Dollar General 2009 Annual Report Download - page 61
Download and view the complete annual report
Please find page 61 of the 2009 Dollar General annual report below. You can navigate through the pages in the report by either clicking on the pages listed below, or by using the keyword search tool below to find specific information within the annual report.-
 1
1 -
2
-
3
-
4
-
5
-
6
-
7
-
8
-
9
-
10
-
11
-
12
-
13
-
14
-
15
-
16
-
17
-
18
-
19
-
20
-
21
-
22
-
23
-
24
-
25
-
26
-
27
-
28
-
29
-
30
-
31
-
32
-
33
-
34
-
35
-
36
-
37
-
38
-
39
-
40
-
41
-
42
-
43
-
44
-
45
-
46
-
47
-
48
-
49
-
50
-
 51
51 -
 52
52 -
 53
53 -
 54
54 -
 55
55 -
 56
56 -
 57
57 -
 58
58 -
 59
59 -
 60
60 -
 61
61 -
 62
62 -
 63
63 -
 64
64 -
 65
65 -
 66
66 -
 67
67 -
 68
68 -
 69
69 -
 70
70 -
 71
71 -
72
-
73
-
74
-
75
-
76
-
77
-
78
-
79
-
80
-
81
-
82
-
83
-
84
-
85
-
86
-
87
-
88
-
89
-
90
-
91
-
92
-
93
-
94
-
95
-
96
-
97
-
98
-
99
-
100
-
101
-
102
-
103
-
104
-
105
-
106
-
107
-
108
-
109
-
110
-
111
-
112
-
113
-
114
-
115
-
116
-
117
-
118
-
119
-
120
-
121
-
122
-
123
-
124
-
125
-
126
-
127
-
128
-
129
-
130
-
131
 |
 |
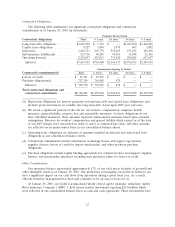
Cash flows from financing activities. In 2009, we had cash inflows from the issuance of equity of
$443.8 million primarily due to our initial public offering of 22.7 million shares of common stock. We
used the proceeds from the offering to repay outstanding Notes with a total principal amount of
$400.9 million, and used cash generated from operations to repay $336.5 million outstanding principal
amount on our Term Loan Facility. We had no borrowings or repayments under the ABL Facility in
2009. We paid a dividend and related amounts totaling $239.7 million using cash generated from
operations.
In 2008, we repaid borrowings of $102.5 million under our ABL Facility and as of January 30,
2009, we had no borrowings under the ABL Facility. Also during 2008, we repurchased $44.1 million of
our outstanding Senior Subordinated Notes.
In the 2007 Successor period, to finance our 2007 merger, we issued long-term debt of
approximately $4.2 billion and issued common stock in the amount of approximately $2.8 billion
(primarily relating to the cash equity contributions from the Investors); we incurred costs associated
with the issuance of merger-related long-term debt of $87.4 million; we completed a cash tender offer
for our 2010 Notes as discussed above, resulting in the valid tender of approximately 99% of the 2010
Notes resulting in repayments of long-term debt and related consent fees in the amount of
$215.6 million; and incurred borrowings, net of repayments, under our ABL Facility of $102.5 million.
The borrowings and repayments under the revolving credit agreements in 2008 and the 2007
Successor period were primarily a result of activity associated with periodic cash needs.
Critical Accounting Policies and Estimates
The preparation of financial statements in accordance with U.S. GAAP requires management to
make estimates and assumptions that affect reported amounts and related disclosures. In addition to
the estimates presented below, there are other items within our financial statements that require
estimation, but are not deemed critical as defined below. We believe these estimates are reasonable and
appropriate. However, if actual experience differs from the assumptions and other considerations used,
the resulting changes could have a material effect on the financial statements taken as a whole.
Management believes the following policies and estimates are critical because they involve
significant judgments, assumptions, and estimates. Management has discussed the development and
selection of the critical accounting estimates with the Audit Committee of our Board of Directors, and
the Audit Committee has reviewed the disclosures presented below relating to those policies and
estimates.
Merchandise Inventories. Merchandise inventories are stated at the lower of cost or market with
cost determined using the retail last-in, first-out (‘‘LIFO’’) method. Under our retail inventory method
(‘‘RIM’’), the calculation of gross profit and the resulting valuation of inventories at cost are computed
by applying a calculated cost-to-retail inventory ratio to the retail value of sales at a department level.
The RIM is an averaging method that has been widely used in the retail industry due to its practicality.
Also, it is recognized that the use of the RIM will result in valuing inventories at the lower of cost or
market (‘‘LCM’’) if markdowns are currently taken as a reduction of the retail value of inventories.
Inherent in the RIM calculation are certain significant management judgments and estimates
including, among others, initial markups, markdowns, and shrinkage, which significantly impact the
gross profit calculation as well as the ending inventory valuation at cost. These significant estimates,
coupled with the fact that the RIM is an averaging process, can, under certain circumstances, produce
distorted cost figures. Factors that can lead to distortion in the calculation of the inventory balance
include:
• applying the RIM to a group of products that is not fairly uniform in terms of its cost and
selling price relationship and turnover;
50