Dish Network 2004 Annual Report Download - page 58
Download and view the complete annual report
Please find page 58 of the 2004 Dish Network annual report below. You can navigate through the pages in the report by either clicking on the pages listed below, or by using the keyword search tool below to find specific information within the annual report.-
 1
1 -
2
-
3
-
4
-
5
-
6
-
7
-
8
-
9
-
10
-
11
-
12
-
13
-
14
-
15
-
16
-
17
-
18
-
19
-
20
-
21
-
22
-
23
-
24
-
25
-
26
-
27
-
28
-
29
-
30
-
31
-
32
-
33
-
34
-
35
-
36
-
37
-
38
-
39
-
40
-
41
-
42
-
43
-
44
-
45
-
46
-
47
-
 48
48 -
 49
49 -
 50
50 -
 51
51 -
 52
52 -
 53
53 -
 54
54 -
 55
55 -
 56
56 -
 57
57 -
 58
58 -
 59
59 -
 60
60 -
 61
61 -
 62
62 -
 63
63 -
 64
64 -
 65
65 -
 66
66 -
 67
67 -
 68
68 -
69
-
70
-
71
-
72
-
73
-
74
-
75
-
76
-
77
-
78
-
79
-
80
-
81
-
82
-
83
-
84
-
85
-
86
-
87
-
88
-
89
-
90
-
91
-
92
-
93
-
94
-
95
-
96
-
97
-
98
-
99
-
100
-
101
-
102
-
103
-
104
-
105
-
106
-
107
-
108
-
109
-
110
-
111
-
112
-
113
-
114
-
115
-
116
-
117
-
118
-
119
-
120
-
121
-
122
-
123
-
124
-
125
-
126
-
127
-
128
-
129
-
130
-
131
-
132
-
133
-
134
-
135
-
136
-
137
-
138
-
139
-
140
-
141
-
142
-
143
-
144
-
145
-
146
-
147
-
148
 |
 |
Item 7. MANAGEMENT’S DISCUSSION AND ANALYSIS OF FINANCIAL CONDITION AND
RESULTS OF OPERATIONS - Continued
50
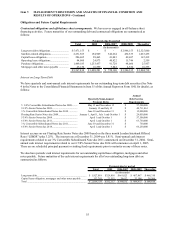
2004 capital expenditures of $980.6 million due to, among other things, increased spending on equipment leased to
subscribers and satellites. Our capital expenditures will vary depending on the number of satellites leased or under
construction at any point in time. Our working capital and capital expenditure requirements could increase materially
in the event of increased competition for subscription television customers, significant satellite failures, in the event we
make strategic investments or acquisitions, or in the event of general economic downturn, among other factors. These
factors could require that we raise additional capital in the future. There can be no assurance that we could raise all
required capital or that required capital would be available on acceptable terms.
Cash, cash equivalents and marketable investment securities. We consider all liquid investments purchased within
90 days of their maturity to be cash equivalents. See “Item 7A. – Quantitative and Qualitative Disclosures About
Market Risk” for further discussion regarding our marketable investment securities. As of December 31, 2004, our
restricted and unrestricted cash, cash equivalents and marketable investment securities totaled $1.213 billion,
including approximately $57.6 million of other restricted cash and marketable investment securities, compared to
$4.170 billion, including $176.8 million of cash reserved for satellite insurance and $20.0 million of other restricted
cash and marketable investment securities, as of December 31, 2003. During 2004, we redeemed the remainder of
our 9 3/8% Senior Notes due 2009 and our 10 3/8% Senior Notes due 2007, using unrestricted cash and marketable
investment securities of approximately $1.545 billion and the proceeds from the sale of our 6 5/8% Senior Notes due
2014. As an indirect result of these redemptions, we reclassified the remaining amount of cash reserved for satellite
insurance to cash and cash equivalents during the fourth quarter of 2004. During 2004, capital expenditures,
repurchases of our Class A common stock and a dividend on our Class A and Class B common stock further reduced
our unrestricted cash and marketable investment securities by approximately $980.6 million, $809.6 million, and
$455.7 million, respectively.
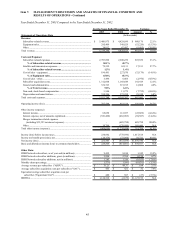
The following discussion highlights our free cash flow and cash flow activities during the years ended December 31,
2004, 2003 and 2002.
Free cash flow. We define free cash flow as “Net cash flows from operating activities” less “Purchases of property
and equipment,” as shown on our Consolidated Statements of Cash Flows. We believe free cash flow is an
important liquidity metric because it measures, during a given period, the amount of cash generated that is available
to repay debt obligations, make investments, fund acquisitions and for certain other activities. Free cash flow is not
a measure determined in accordance with GAAP and should not be considered a substitute for “Operating income,”
“Net income,” “Net cash flows from operating activities” or any other measure determined in accordance with
GAAP. Since free cash flow includes investments in operating assets, we believe this non-GAAP liquidity measure
is useful in addition to the most directly comparable GAAP measure - “Net cash flows from operating activities.”
Free cash flow was $20.9 million, $253.8 million and negative $369.1 million for the years ended December 31, 2004,
2003 and 2002, respectively. The decrease from 2003 to 2004 of approximately $232.9 million resulted from an
approximate $658.8 million increase in “Purchases of property and equipment” offset by an increase in “Net cash flows
from operating activities” of approximately $425.9 million. The increase in “Purchases of property and equipment”
was primarily attributable to increased spending for equipment under our lease programs, satellite construction
payments and prepayments under our satellite service agreements, and for general expansion to support the growth of
the DISH Network. The increase in “Net cash flows from operating activities” was primarily attributable to
significantly more cash flow generated by changes in operating assets and liabilities in 2004 as compared to 2003.
Cash flow from changes in operating assets and liabilities was $241.7 million during 2004 compared to negative $75.7
million in 2003. The improvement in cash flow from changes in operating assets and liabilities resulted from increases
in accounts payable, accrued programming expenses, and an increase in net deferred revenue primarily attributable to
equipment sales to SBC, partially offset by rising inventory levels, increased subscriber accounts receivable and
receivables related to SBC.
The increase in free cash flow from 2002 to 2003 of approximately $622.8 million resulted from an increase in “Net
cash flows from operating activities” of approximately $508.8 million and a decrease in “Purchases of property and
equipment” of approximately $114.0 million. The increase in “Net cash flows from operating activities” is primarily
attributable to an improvement in net income that principally resulted from approximately $689.8 million in merger
termination related expenses incurred during 2002 as discussed in Management’s Discussion and Analysis of Financial
Condition and Results of Operations. The improvement in net income was offset by significantly less cash flow
generated from changes in operating assets and liabilities in 2003 as compared to 2002. Cash flow from changes in