Dish Network 2004 Annual Report Download - page 41
Download and view the complete annual report
Please find page 41 of the 2004 Dish Network annual report below. You can navigate through the pages in the report by either clicking on the pages listed below, or by using the keyword search tool below to find specific information within the annual report.-
 1
1 -
2
-
3
-
4
-
5
-
6
-
7
-
8
-
9
-
10
-
11
-
12
-
13
-
14
-
15
-
16
-
17
-
18
-
19
-
20
-
21
-
22
-
23
-
24
-
25
-
26
-
27
-
28
-
29
-
30
-
 31
31 -
 32
32 -
 33
33 -
 34
34 -
 35
35 -
 36
36 -
 37
37 -
 38
38 -
 39
39 -
 40
40 -
 41
41 -
 42
42 -
 43
43 -
 44
44 -
 45
45 -
 46
46 -
 47
47 -
 48
48 -
 49
49 -
 50
50 -
 51
51 -
52
-
53
-
54
-
55
-
56
-
57
-
58
-
59
-
60
-
61
-
62
-
63
-
64
-
65
-
66
-
67
-
68
-
69
-
70
-
71
-
72
-
73
-
74
-
75
-
76
-
77
-
78
-
79
-
80
-
81
-
82
-
83
-
84
-
85
-
86
-
87
-
88
-
89
-
90
-
91
-
92
-
93
-
94
-
95
-
96
-
97
-
98
-
99
-
100
-
101
-
102
-
103
-
104
-
105
-
106
-
107
-
108
-
109
-
110
-
111
-
112
-
113
-
114
-
115
-
116
-
117
-
118
-
119
-
120
-
121
-
122
-
123
-
124
-
125
-
126
-
127
-
128
-
129
-
130
-
131
-
132
-
133
-
134
-
135
-
136
-
137
-
138
-
139
-
140
-
141
-
142
-
143
-
144
-
145
-
146
-
147
-
148
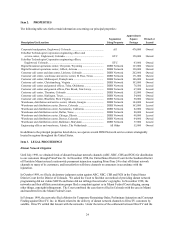
 |
 |

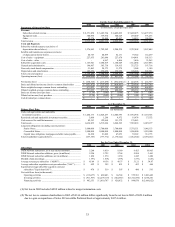
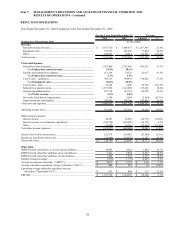
33
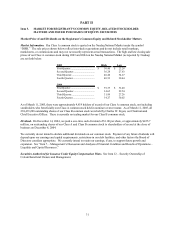
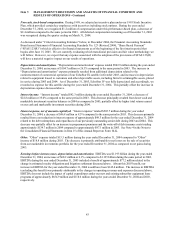
For the Years Ended December 31,
200020012002
2003 2004
Statements of Operations Data (In thousands, except per share data)
Revenue:
Subscriber-related revenue.............................................................. 2,371,850$ 3,605,724$ 4,429,699$ 5,409,875$ 6,677,370$
Equipment sales.............................................................................. 300,996 359,934 348,629 295,409 373,253
Other .............................................................................................. 42,374 35,480 42,497 34,012 100,593
Total revenue .................................................................................... 2,715,220 4,001,138 4,820,825 5,739,296 7,151,216
Costs and Expenses:
Subscriber related expenses (exclusive of
depreciation shown below).............................................................. 1,276,943 1,792,542 2,200,239 2,707,898 3,567,409
Satellite and transmission expenses (exclusive
of depreciation shown below)......................................................... 44,719 40,899 62,131 79,322 112,239
Cost of sales – equipment .................................................................. 227,955 263,046 227,670 194,491 305,313
Cost of sales – other .......................................................................... - 6,967 6,466 3,496 33,265
Subscriber acquisition costs............................................................... 1,155,941 1,080,819 1,168,649 1,312,068 1,527,886
General and administrative ................................................................ 196,907 305,738 319,915 332,723 397,718
Non-cash, stock-based compensation ................................................ 51,465 20,173 11,279 3,544 1,180
Depreciation and amortization........................................................... 185,356 278,652 372,958 398,206 502,901
Total costs and expenses .................................................................. 3,139,286 3,788,836 4,369,307 5,031,748 6,447,911
Operating income (loss) .................................................................... (424,066)$ 212,302$ 451,518$ 707,548$ 703,305$
Net income (loss) ............................................................................. (650,326)$ (215,498)$ (852,034)$ (1) 224,506$ 214,769$
Basic and diluted net income (loss) to common shareholders .......... (651,472)$ (215,835)$ (414,601)$ (2) 224,506$ 214,769$
Basic weighted-average common shares outstanding......................... 471,023 477,172 480,429 483,098 464,053
Diluted weighted-average common shares outstanding...................... 471,023 477,172 480,429 488,314 467,598
Basic net income (loss) per share ...................................................... (1.38)$ (0.45)$ (0.86)$ 0.46$ 0.46$
Diluted net income (loss) per share ................................................... (1.38)$ (0.45)$ (0.86)$ 0.46$ 0.46$
Cash dividend per common share...................................................... -$ -$ -$ -$ 1.00$
As of December 31,
2000 2001 2002 2003 2004
Balance Sheet Data (In thousands)
Cash, cash equivalents and marketable
investment securities........................................................................ 1,464,175$ 2,828,297$ 2,686,995$ 3,972,974$ 1,155,633$
Restricted cash and marketable investment securities........................ 3,000 1,288 9,972 19,974 57,552
Cash reserved for satellite insurance.................................................. 82,393 122,068 151,372 176,843 -
Total assets......................................................................................... 4,636,835 6,519,686 6,260,585 7,585,018 6,029,277
Long-term obligations (including current portion):
Senior Notes.................................................................................. 3,000,000 3,700,000 3,700,000 5,378,351 3,946,153
Convertible Notes......................................................................... 1,000,000 2,000,000 2,000,000 1,500,000 1,525,000
Capital lease obligation, mortgages and other notes payable........ 36,290 21,602 47,053 59,322 331,735
Total stockholders' equity (deficit)..................................................... (657,383) (777,772) (1,176,022) (1,032,524) (2,078,212)
For the Year Ended December 31,
2000 2001 2002 2003 2004
Other Data
DISH Network subscribers, as of year end (in millions).................... 5.260 6.830 8.180 9.425 10.905
DISH Network subscriber additions, gross (in millions).................... 2.554 2.722 2.764 2.894 3.441
DISH Network subscriber additions, net (in millions)....................... 1.850 1.570 1.350 1.245 1.480
Monthly churn percentage.................................................................. 1.39% 1.60% 1.59% 1.57% 1.62%
Average revenue per subscriber ("ARPU")....................................... 45.69$ 49.56$ 49.37$ 51.21$ 54.87$
Average subscriber acquisition costs per subscriber ("SAC")........... 452$ 395$ 421$ 453$ 444$
Equivalent average subscriber acquition costs per
subscriber ("Equivalent SAC")..................................................... 478$ 519$ 507$ 480$ 593$
Net cash flows from (in thousands):
Operating activities ...................................................................... (118,677)$ 489,483$ 66,744$ 575,581$ 1,001,442$
Investing activities ....................................................................... (911,957)$ (1,279,119)$ (682,387)$ (1,761,870)$ 1,078,281$
Financing activities ...................................................................... 982,153$ 1,610,707$ 420,832$ 994,070$ (2,666,022)$
(1) Net loss in 2002 includes $689.8 million related to merger termination costs.
(2) The net loss to common shareholders in 2002 of $414.6 million differs significantly from the net loss in 2002 of $852.0 million
due to a gain on repurchase of Series D Convertible Preferred Stock of approximately $437.4 million.