Dish Network 2004 Annual Report Download - page 49
Download and view the complete annual report
Please find page 49 of the 2004 Dish Network annual report below. You can navigate through the pages in the report by either clicking on the pages listed below, or by using the keyword search tool below to find specific information within the annual report.-
 1
1 -
2
-
3
-
4
-
5
-
6
-
7
-
8
-
9
-
10
-
11
-
12
-
13
-
14
-
15
-
16
-
17
-
18
-
19
-
20
-
21
-
22
-
23
-
24
-
25
-
26
-
27
-
28
-
29
-
30
-
31
-
32
-
33
-
34
-
35
-
36
-
37
-
38
-
 39
39 -
 40
40 -
 41
41 -
 42
42 -
 43
43 -
 44
44 -
 45
45 -
 46
46 -
 47
47 -
 48
48 -
 49
49 -
 50
50 -
 51
51 -
 52
52 -
 53
53 -
 54
54 -
 55
55 -
 56
56 -
 57
57 -
 58
58 -
 59
59 -
60
-
61
-
62
-
63
-
64
-
65
-
66
-
67
-
68
-
69
-
70
-
71
-
72
-
73
-
74
-
75
-
76
-
77
-
78
-
79
-
80
-
81
-
82
-
83
-
84
-
85
-
86
-
87
-
88
-
89
-
90
-
91
-
92
-
93
-
94
-
95
-
96
-
97
-
98
-
99
-
100
-
101
-
102
-
103
-
104
-
105
-
106
-
107
-
108
-
109
-
110
-
111
-
112
-
113
-
114
-
115
-
116
-
117
-
118
-
119
-
120
-
121
-
122
-
123
-
124
-
125
-
126
-
127
-
128
-
129
-
130
-
131
-
132
-
133
-
134
-
135
-
136
-
137
-
138
-
139
-
140
-
141
-
142
-
143
-
144
-
145
-
146
-
147
-
148
 |
 |
Item 7. MANAGEMENT’S DISCUSSION AND ANALYSIS OF FINANCIAL CONDITION AND
RESULTS OF OPERATIONS - Continued
41
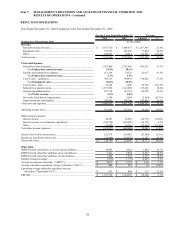
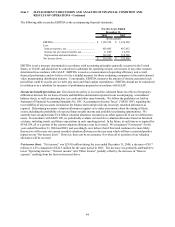
Satellite and transmission expenses. “Satellite and transmission expenses” totaled $112.2 million during the year
ended December 31, 2004, an increase of $32.9 million or 41.5% compared to the same period in 2003. This increase
primarily resulted from commencement of service and operational costs associated with the increasing number of
markets in which we offer local network channels by satellite as previously discussed, and increases in our FSS
satellite lease payment obligations. “Satellite and transmission expenses” totaled 1.7% and 1.5% of “Subscriber-
related revenue” during each of the years ended December 31, 2004 and 2003, respectively. The increase in the
expense to revenue ratio principally resulted from additional operational costs to support the commencement of service
and on-going operations of our local markets discussed above. These expenses will increase further in the future as
we increase the size of our satellite fleet, if we obtain in-orbit satellite insurance, as we increase the number and
operations of our digital broadcast centers and as additional local markets and other programming services are
launched.
Cost of sales – equipment. “Cost of sales – equipment” totaled $305.3 million during the year ended December 31,
2004, an increase of $110.8 million or 57.0% compared to the same period in 2003. This increase primarily resulted
from the increase in sales of DBS accessories to retailers and other distributors of our equipment domestically and to
DISH Network subscribers discussed above, and approximately $18.4 million in charges related to slow moving and
obsolete inventory. “Cost of sales – equipment” represented 81.8% and 65.8% of “Equipment sales,” during the years
ended December 31, 2004 and 2003, respectively. The increase in the expense to revenue ratio principally related to
the charges for slow moving and obsolete inventory discussed above, and an approximate $6.8 million reduction in the
cost of set-top box equipment during 2003 resulting from a change in estimated royalty obligations. This increase in
the expense to revenue ratio also related to a decline in margins on the sales of DBS accessories and on sales by our
ETC subsidiary to an international DBS service provider due to reductions in prices and increased sales of lower
margin accessories.
Cost of sales – other. “Cost of sales – other” totaled $33.3 million during the year ended December 31, 2004, an
increase of $29.8 million compared to the same period in 2003. This increase is primarily attributable to expenses
associated with the C-band subscription television service business of SNG we acquired in April 2004.
Subscriber acquisition costs. “Subscriber acquisition costs” totaled approximately $1.528 billion for the year ended
December 31, 2004, an increase of $215.8 million or 16.4% compared to the same period in 2003. “Subscriber
acquisition costs” during the year ended December 31, 2003 included a benefit of approximately $77.2 million
comprised of approximately $42.8 million related to a reduction in the cost of set-top box equipment resulting from a
change in estimated royalty obligations and $34.4 million from a litigation settlement. The increase in “Subscriber
acquisition costs” was attributable to a larger number of gross DISH Network subscriber additions during the year
ended December 2004 compared to the same period in 2003, partially offset by a higher number of DISH Network
subscribers participating in our equipment lease program and the acquisition of co-branded subscribers during 2004 as
discussed under “SAC and Equivalent SAC” below.
SAC and Equivalent SAC. Subscriber acquisition costs per new DISH Network subscriber activation were
approximately $444 for the year ended December 31, 2004 and approximately $453 during the same period in 2003.
SAC during the year ended December 31, 2003 included the benefit of approximately $77.2 million discussed above.
Absent this benefit, our SAC for 2003 would have been approximately $27 higher, or $480. The decrease in SAC
during the year ended December 31, 2004 as compared to the same period in 2003 (excluding this benefit) was directly
attributable to the acquisition of co-branded subscribers during 2004. Excluding the effect of co-branded subscribers,
SAC would have increased during the current year as compared to the same period in 2003. The increase in SAC
(excluding the effect of co-branded subscribers) was primarily related to more expensive promotions offered during
2004 including up to three free receivers for new subscribers and free advanced products, such as digital video
recorders and high definition receivers. Further, during 2004, since a greater number of DISH Network subscribers
activated multiple receivers, receivers with multiple tuners or other advanced products, including SuperDISH,
installation costs increased as compared to 2003. These factors were partially offset by an increase in DISH Network
subscribers participating in our equipment lease program and reduced subscriber acquisition advertising.
Penetration of our equipment lease program increased during the second half of 2004. Our capital expenditures will
continue to increase to the extent we maintain or increase our lease penetration as a percentage of new subscriber
additions. However, we believe the increase in capital expenditures from penetration of our equipment lease program
will continue to be partially mitigated by the redeployment of equipment returned by disconnected lease program