Dish Network 2004 Annual Report Download - page 57
Download and view the complete annual report
Please find page 57 of the 2004 Dish Network annual report below. You can navigate through the pages in the report by either clicking on the pages listed below, or by using the keyword search tool below to find specific information within the annual report.-
 1
1 -
2
-
3
-
4
-
5
-
6
-
7
-
8
-
9
-
10
-
11
-
12
-
13
-
14
-
15
-
16
-
17
-
18
-
19
-
20
-
21
-
22
-
23
-
24
-
25
-
26
-
27
-
28
-
29
-
30
-
31
-
32
-
33
-
34
-
35
-
36
-
37
-
38
-
39
-
40
-
41
-
42
-
43
-
44
-
45
-
46
-
 47
47 -
 48
48 -
 49
49 -
 50
50 -
 51
51 -
 52
52 -
 53
53 -
 54
54 -
 55
55 -
 56
56 -
 57
57 -
 58
58 -
 59
59 -
 60
60 -
 61
61 -
 62
62 -
 63
63 -
 64
64 -
 65
65 -
 66
66 -
 67
67 -
68
-
69
-
70
-
71
-
72
-
73
-
74
-
75
-
76
-
77
-
78
-
79
-
80
-
81
-
82
-
83
-
84
-
85
-
86
-
87
-
88
-
89
-
90
-
91
-
92
-
93
-
94
-
95
-
96
-
97
-
98
-
99
-
100
-
101
-
102
-
103
-
104
-
105
-
106
-
107
-
108
-
109
-
110
-
111
-
112
-
113
-
114
-
115
-
116
-
117
-
118
-
119
-
120
-
121
-
122
-
123
-
124
-
125
-
126
-
127
-
128
-
129
-
130
-
131
-
132
-
133
-
134
-
135
-
136
-
137
-
138
-
139
-
140
-
141
-
142
-
143
-
144
-
145
-
146
-
147
-
148
 |
 |

Item 7. MANAGEMENT’S DISCUSSION AND ANALYSIS OF FINANCIAL CONDITION AND
RESULTS OF OPERATIONS - Continued
49
revenue sufficient to support the cost of new and existing subscribers. The improvement was partially offset by a
decrease in subscribers leasing equipment and a corresponding increase in equipment subsidies compared to the same
period in 2002, as well as a decrease in “Equipment sales.” EBITDA does not include the impact of capital
expenditures under our new and existing subscriber equipment lease program of approximately $118.6 million during
2003, and our new subscriber equipment lease program of $277.6 million during 2002.
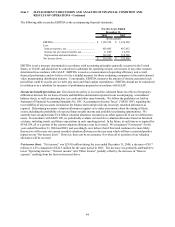
The following table reconciles EBITDA to the accompanying financial statements:
For the Years Ended
December 31,
2003 2002
(In thousands)
EBITDA................................................................ 1,124,520$ (2,679)$
Less:
Interest expense, net ........................................... 487,432 369,976
Interest expense, merger related.......................... - 33,323
Income tax provision (benefit), net...................... 14,376 73,098
Depreciation and amortization............................ 398,206 372,958
N
et income (loss).................................................. 224,506$ (852,034)$
EBITDA is not a measure determined in accordance with accounting principles generally accepted in the United
States, or GAAP, and should not be considered a substitute for operating income, net income or any other measure
determined in accordance with GAAP. EBITDA is used as a measurement of operating efficiency and overall
financial performance and we believe it to be a helpful measure for those evaluating companies in the multi-channel
video programming distribution industry. Conceptually, EBITDA measures the amount of income generated each
period that could be used to service debt, pay taxes and fund capital expenditures. EBITDA should not be considered
in isolation or as a substitute for measures of performance prepared in accordance with GAAP.
Net income (loss). “Net income” was $224.5 million during the year ended December 31, 2003, an increase of $1.077
billion compared to a “Net loss” of $852.0 million for the same period in 2002. The improvement was primarily
attributable to an increase in “Operating income” and an improvement in “Other” expense, the components of which
are discussed above.
Basic and diluted net income (loss) to common shareholders. “Basic and diluted net income to common
shareholders” was $224.5 million during the year ended December 31, 2003, an improvement of $639.1 million
compared to “Basic and diluted net loss to common shareholders” of $414.6 million for the same period in 2002. The
improvement is primarily attributable to the improvement in “Net loss,” discussed above. The improvement was
partially offset by a $437.4 million gain on the redemption of Series D convertible preferred stock from Vivendi during
2002.
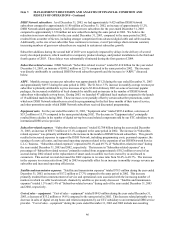
LIQUIDITY AND CAPITAL RESOURCES
Our principal sources of cash during 2004 were operating activities, sales of certain marketable investment securities
and the issuance of long-term notes. Our principal uses of cash during 2004 were to repurchase or redeem long-term
notes, purchase property and equipment, repurchase our Class A common stock and pay a dividend on our Class A and
Class B common stock. See further discussion of 2004 financings in “Cash flows from financing activities” below.
We expect that our future working capital, capital expenditure and debt service requirements will be satisfied primarily
from existing cash and investment balances and cash generated from operations. Our ability to generate positive future
operating and net cash flows is dependent upon, among other things, our ability to retain existing DISH Network
subscribers. There can be no assurance we will be successful in executing our business plan. The amount of capital
required to fund our 2005 working capital and capital expenditure needs will vary, depending, among other things, on
the rate at which we acquire new subscribers and the cost of subscriber acquisition and retention, including capitalized
costs associated with our new and existing subscriber equipment lease programs. The amount of capital required in
2005 will also depend on our levels of investment in infrastructure necessary to support local markets and other
possible strategic initiatives. We currently anticipate that 2005 capital expenditures will be significantly higher than