Dish Network 2004 Annual Report Download - page 46
Download and view the complete annual report
Please find page 46 of the 2004 Dish Network annual report below. You can navigate through the pages in the report by either clicking on the pages listed below, or by using the keyword search tool below to find specific information within the annual report.-
 1
1 -
2
-
3
-
4
-
5
-
6
-
7
-
8
-
9
-
10
-
11
-
12
-
13
-
14
-
15
-
16
-
17
-
18
-
19
-
20
-
21
-
22
-
23
-
24
-
25
-
26
-
27
-
28
-
29
-
30
-
31
-
32
-
33
-
34
-
35
-
 36
36 -
 37
37 -
 38
38 -
 39
39 -
 40
40 -
 41
41 -
 42
42 -
 43
43 -
 44
44 -
 45
45 -
 46
46 -
 47
47 -
 48
48 -
 49
49 -
 50
50 -
 51
51 -
 52
52 -
 53
53 -
 54
54 -
 55
55 -
 56
56 -
57
-
58
-
59
-
60
-
61
-
62
-
63
-
64
-
65
-
66
-
67
-
68
-
69
-
70
-
71
-
72
-
73
-
74
-
75
-
76
-
77
-
78
-
79
-
80
-
81
-
82
-
83
-
84
-
85
-
86
-
87
-
88
-
89
-
90
-
91
-
92
-
93
-
94
-
95
-
96
-
97
-
98
-
99
-
100
-
101
-
102
-
103
-
104
-
105
-
106
-
107
-
108
-
109
-
110
-
111
-
112
-
113
-
114
-
115
-
116
-
117
-
118
-
119
-
120
-
121
-
122
-
123
-
124
-
125
-
126
-
127
-
128
-
129
-
130
-
131
-
132
-
133
-
134
-
135
-
136
-
137
-
138
-
139
-
140
-
141
-
142
-
143
-
144
-
145
-
146
-
147
-
148
 |
 |

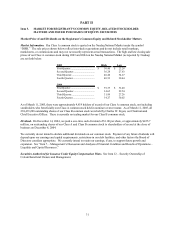
Item 7. MANAGEMENT’S DISCUSSION AND ANALYSIS OF FINANCIAL CONDITION AND
RESULTS OF OPERATIONS - Continued
38
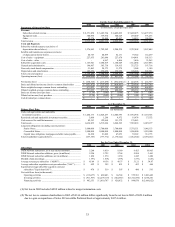
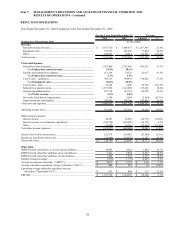
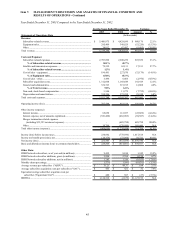
RESULTS OF OPERATIONS
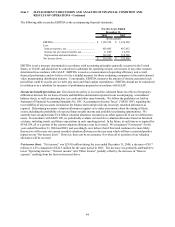
Year Ended December 31, 2004 Compared to the Year Ended December 31, 2003.
For the Years Ended December 31, Variance
2004 2003 Amount %
Statements of Operations Data (In thousands)
Revenue:
Subscriber-related revenue..................................................................... 6,677,370$ 5,409,875$ 1,267,495$ 23.4%
Equipment sales...................................................................................... 373,253 295,409 77,844 26.4%
Other....................................................................................................... 100,593 34,012 66,581 195.8%
Total revenue............................................................................................. 7,151,216 5,739,296 1,411,920 24.6%
Costs and Expenses:
Subscriber-related expenses................................................................... 3,567,409 2,707,898 859,511 31.7%
% of Subscriber-related revenue................................................. 53.4% 50.1%
Satellite and transmission expenses........................................................ 112,239 79,322 32,917 41.5%
% of Subscriber-related revenue................................................. 1.7% 1.5%
Cost of sales - equipment....................................................................... 305,313 194,491 110,822 57.0%
% of Equipment sales.................................................................... 81.8% 65.8%
Cost of sales - other................................................................................ 33,265 3,496 29,769 851.5%
Subscriber acquisition costs................................................................... 1,527,886 1,312,068 215,818 16.4%
General and administrative..................................................................... 397,718 332,723 64,995 19.5%
% of Total revenue........................................................................ 5.6% 5.8%
Non-cash, stock-based compensation..................................................... 1,180 3,544 (2,364) (66.7%)
Depreciation and amortization............................................................... 502,901 398,206 104,695 26.3%
Total costs and expenses........................................................................... 6,447,911 5,031,748 1,416,163 28.1%
Operating income (loss)............................................................................ 703,305 707,548 (4,243) (0.6%)
Other income (expense):
Interest income....................................................................................... 42,287 65,058 (22,771) (35.0%)
Interest expense, net of amounts capitalized.......................................... (505,732) (552,490) 46,758 8.5%
Other....................................................................................................... (13,482) 18,766 (32,248) (171.8%)
Total other income (expense).................................................................... (476,927) (468,666) (8,261) (1.8%)
Income (loss) before income taxes............................................................ 226,378 238,882 (12,504) (5.2%)
Income tax benefit (provision), net............................................................ (11,609) (14,376) 2,767 19.2%
Net income (loss)...................................................................................... 214,769$ 224,506$ (9,737)$ (4.3%)
Other Data:
DISH Network subscribers, as of year end (in millions)........................... 10.905 9.425 1.480 15.7%
DISH Network subscriber additions, gross (in millions)........................... 3.441 2.894 0.547 18.9%
DISH Network subscriber additions, net (in millions).............................. 1.480 1.245 0.235 18.9%
Monthly churn percentage......................................................................... 1.62% 1.57% 0.05% 3.2%
Average revenue per subscriber ("ARPU").............................................. 54.87$ 51.21$ 3.66$ 7.1%
Average subscriber acquisition costs per subscriber ("SAC")................... 444$ 453$ (9)$ (2.0%)
Equivalent average subscriber acquition costs per
subscriber ("Equivalent SAC")............................................................. 593$ 480$ 113$ 23.5%
EBITDA.................................................................................................... 1,192,724$ 1,124,520$ 68,204$ 6.1%