Costco 2005 Annual Report Download - page 62
Download and view the complete annual report
Please find page 62 of the 2005 Costco annual report below. You can navigate through the pages in the report by either clicking on the pages listed below, or by using the keyword search tool below to find specific information within the annual report.-
 1
1 -
2
-
3
-
4
-
5
-
6
-
7
-
8
-
9
-
10
-
11
-
12
-
13
-
14
-
15
-
16
-
17
-
18
-
19
-
20
-
21
-
22
-
23
-
24
-
25
-
26
-
27
-
28
-
29
-
30
-
31
-
32
-
33
-
34
-
35
-
36
-
37
-
38
-
39
-
40
-
41
-
42
-
43
-
44
-
45
-
46
-
47
-
48
-
49
-
50
-
51
-
 52
52 -
 53
53 -
 54
54 -
 55
55 -
 56
56 -
 57
57 -
 58
58 -
 59
59 -
 60
60 -
 61
61 -
 62
62 -
 63
63 -
 64
64 -
 65
65 -
 66
66 -
 67
67
 |
 |

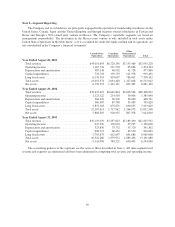
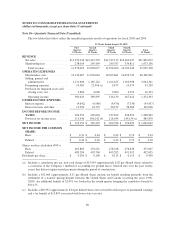
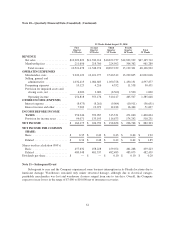
Note 10—Quarterly Financial Data (Unaudited) (Continued)
52 Weeks Ended August 29, 2004
First
Quarter
12 Weeks
Second
Quarter
12 Weeks
Third
Quarter
12 Weeks
Fourth
Quarter
16 Weeks
Total
52 Weeks
REVENUE
Net sales ..................... $10,309,822 $11,330,214 $10,672,737 $14,832,939 $47,145,712
Membership fees ............... 211,656 218,760 224,502 306,362 961,280
Totalrevenue................ 10,521,478 11,548,974 10,897,239 15,139,301 48,106,992
OPERATING EXPENSES
Merchandise costs .............. 9,220,122 10,101,977 9,540,312 13,229,605 42,092,016
Selling, general and
administrative ............... 1,032,413 1,084,605 1,050,728 1,430,131 4,597,877
Preopeningexpenses ............ 10,125 4,216 4,552 11,558 30,451
Provision for impaired assets and
closing costs, net ............. 4,000 3,000 (8,500) 2,500 1,000
Operating income ............ 254,818 355,176 310,147 465,507 1,385,648
OTHER INCOME (EXPENSE)
Interest expense ................ (8,475) (8,261) (9,004) (10,911) (36,651)
Interest income and other ........ 7,903 13,072 14,188 16,464 51,627
INCOME BEFORE INCOME
TAXES ...................... 254,246 359,987 315,331 471,060 1,400,624
Provision for income taxes ....... 94,071 133,195 116,673 174,292 518,231
NET INCOME .................. $ 160,175 $ 226,792 $ 198,658 $ 296,768 $ 882,393
NET INCOME PER COMMON
SHARE:
Basic ........................ $ 0.35 $ 0.49 $ 0.43 $ 0.64 $ 1.92
Diluted....................... $ 0.34 $ 0.48 $ 0.42 $ 0.62 $ 1.85
Shares used in calculation (000’s)
Basic ........................ 457,632 458,228 459,074 461,268 459,223
Diluted....................... 480,348 481,537 482,485 485,073 482,459
Dividendspershare............... $ — $ — $ 0.10 $ 0.10 $ 0.20
Note 11—Subsequent Event
Subsequent to year end the Company experienced some business interruption in its Florida locations due to
hurricane damage. Warehouses sustained only minor structural damage, although due to electrical outages,
perishable merchandise was lost and warehouse closures ranged from one to ten days. Overall, the Company
expects to incur losses in the range of $7,000 to $10,000 net of insurance recoveries.
61