Costco 2005 Annual Report Download - page 39
Download and view the complete annual report
Please find page 39 of the 2005 Costco annual report below. You can navigate through the pages in the report by either clicking on the pages listed below, or by using the keyword search tool below to find specific information within the annual report.-
 1
1 -
2
-
3
-
4
-
5
-
6
-
7
-
8
-
9
-
10
-
11
-
12
-
13
-
14
-
15
-
16
-
17
-
18
-
19
-
20
-
21
-
22
-
23
-
24
-
25
-
26
-
27
-
28
-
 29
29 -
 30
30 -
 31
31 -
 32
32 -
 33
33 -
 34
34 -
 35
35 -
 36
36 -
 37
37 -
 38
38 -
 39
39 -
 40
40 -
 41
41 -
 42
42 -
 43
43 -
 44
44 -
 45
45 -
 46
46 -
 47
47 -
 48
48 -
 49
49 -
50
-
51
-
52
-
53
-
54
-
55
-
56
-
57
-
58
-
59
-
60
-
61
-
62
-
63
-
64
-
65
-
66
-
67
 |
 |

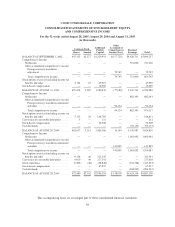
COSTCO WHOLESALE CORPORATION
CONSOLIDATED STATEMENTS OF STOCKHOLDERS’ EQUITY
AND COMPREHENSIVE INCOME
For the 52 weeks ended August 28, 2005, August 29, 2004 and August 31, 2003
(in thousands)
Common Stock Additional
Paid-In
Capital
Other
Accumulated
Comprehensive
Income/(Loss)
Retained
Earnings TotalShares Amount
BALANCE AT SEPTEMBER 1, 2002 ..... 455,325 $2,277 $1,220,954 $(157,725) $4,628,731 $5,694,237
Comprehensive Income
Net Income ......................... — — — — 721,000 721,000
Other accumulated comprehensive income
Foreign currency translation
adjustment ....................... — — — 79,745 — 79,745
Total comprehensive income ......... — — — 79,745 721,000 800,745
Stock options exercised including income tax
benefits and other .................... 2,154 10 47,919 — — 47,929
Stock-based compensation ............... — — 12,069 — — 12,069
BALANCE AT AUGUST 31, 2003 ....... 457,479 2,287 1,280,942 (77,980) 5,349,731 6,554,980
Comprehensive Income
Net Income ......................... — — — — 882,393 882,393
Other accumulated comprehensive income
Foreign currency translation adjustment
and other ........................ — — — 94,124 — 94,124
Total comprehensive income ......... — — — 94,124 882,393 976,517
Stock options exercised including income tax
benefits and other .................... 5,153 26 148,785 — — 148,811
Conversion of convertible debentures ...... 5 — 131 — — 131
Stock-based compensation ............... — — 36,508 — — 36,508
Cash dividends ........................ — — — — (92,137) (92,137)
BALANCE AT AUGUST 29, 2004 ....... 462,637 2,313 1,466,366 16,144 6,139,987 7,624,810
Comprehensive Income
Net Income ......................... — — — — 1,063,092 1,063,092
Other accumulated comprehensive income
Foreign currency translation adjustment
and other ........................ — — — 141,895 — 141,895
Total comprehensive income ......... — — — 141,895 1,063,092 1,204,987
Stock options exercised including income tax
benefits and other .................... 9,138 46 323,545 — — 323,591
Conversion of convertible debentures ...... 9,910 49 277,554 — — 277,603
Stock repurchase ...................... (9,205) (46) (38,848) — (374,358) (413,252)
Stock-based compensation ............... — — 67,937 — — 67,937
Cash dividends ........................ — — — — (204,567) (204,567)
BALANCE AT AUGUST 28, 2005 ....... 472,480 $2,362 $2,096,554 $ 158,039 $6,624,154 $8,881,109
The accompanying notes are an integral part of these consolidated financial statements.
38