Costco 2005 Annual Report Download - page 61
Download and view the complete annual report
Please find page 61 of the 2005 Costco annual report below. You can navigate through the pages in the report by either clicking on the pages listed below, or by using the keyword search tool below to find specific information within the annual report.-
 1
1 -
2
-
3
-
4
-
5
-
6
-
7
-
8
-
9
-
10
-
11
-
12
-
13
-
14
-
15
-
16
-
17
-
18
-
19
-
20
-
21
-
22
-
23
-
24
-
25
-
26
-
27
-
28
-
29
-
30
-
31
-
32
-
33
-
34
-
35
-
36
-
37
-
38
-
39
-
40
-
41
-
42
-
43
-
44
-
45
-
46
-
47
-
48
-
49
-
50
-
 51
51 -
 52
52 -
 53
53 -
 54
54 -
 55
55 -
 56
56 -
 57
57 -
 58
58 -
 59
59 -
 60
60 -
 61
61 -
 62
62 -
 63
63 -
 64
64 -
 65
65 -
 66
66 -
 67
67
 |
 |

NOTES TO CONSOLIDATED FINANCIAL STATEMENTS
(dollars in thousands, except per share data) (Continued)
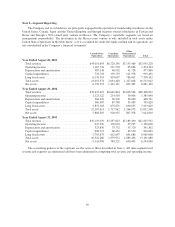
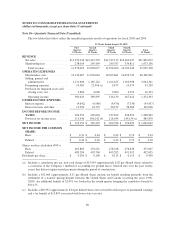
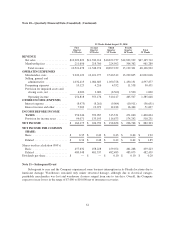
Note 10—Quarterly Financial Data (Unaudited)
The two tables that follow reflect the unaudited quarterly results of operations for fiscal 2005 and 2004.
52 Weeks Ended August 28, 2005
First
Quarter
12 Weeks
Second
Quarter
12 Weeks
Third
Quarter
12 Weeks
Fourth
Quarter
16 Weeks
Total
52 Weeks
REVENUE
Net sales ..................... $11,339,944 $12,412,578 $11,747,113 $16,362,437 $51,862,072
Membership fees ............... 238,059 245,499 249,787 339,811 1,073,156
Totalrevenue................ 11,578,003 12,658,077 11,996,900 16,702,248 52,935,228
OPERATING EXPENSES
Merchandise costs .............. 10,132,487 11,056,064 10,503,661 14,654,749 46,346,961
Selling, general and
administrative ............... 1,131,686 1,185,122 1,164,625 1,562,908 5,044,341
Preopeningexpenses ............ 10,385 22,996(a) 9,475 10,374 53,230
Provision for impaired assets and
closing costs, net ............. 2,800 4,000 3,000 6,593 16,393
Operating income ............ 300,645 389,895 316,139 467,624 1,474,303
OTHER INCOME (EXPENSE)
Interest expense ................ (9,642) (8,980) (8,476) (7,339) (34,437)
Interest income and other ........ 15,590 24,779 30,159 38,568 109,096
INCOME BEFORE INCOME
TAXES ...................... 306,593 405,694 337,822 498,853 1,548,962
Provision for income taxes ....... 113,440 100,242 (b) 128,034 144,154 (c) 485,870
NET INCOME .................. $ 193,153 $ 305,452 $ 209,788 $ 354,699 $ 1,063,092
NET INCOME PER COMMON
SHARE:
Basic ........................ $ 0.41 $ 0.64 $ 0.44 $ 0.74 $ 2.24
Diluted....................... $ 0.40 $ 0.62 $ 0.43 $ 0.73 $ 2.18
Shares used in calculation (000’s)
Basic ........................ 465,869 474,221 478,248 476,636 473,945
Diluted....................... 489,284 493,700 493,282 491,392 492,035
Dividendspershare............... $ 0.100 $ 0.100 $ 0.115 $ 0.115 $ 0.430
(a) Includes a cumulative pre-tax, non-cash charge of $15,999 (approximately $.02 per diluted share) related to
a correction of the Company’s method of accounting for ground leases (entered into over the past twenty
years) that did not require rental payments during the period of construction.
(b) Includes a $52,064 (approximately $.11 per diluted share) income tax benefit resulting primarily from the
settlement of a transfer pricing dispute between the United States and Canada (covering the years 1996-
2003). An additional benefit of $2,091 was booked in the fourth quarter bringing the cumulative benefit to
$54,155.
(c) Includes a $20,592 (approximately $.04 per diluted share) net tax benefit with respect to unremitted earnings
and a tax benefit of $13,895 associated with lower state tax rates.
60