Costco 2005 Annual Report Download - page 40
Download and view the complete annual report
Please find page 40 of the 2005 Costco annual report below. You can navigate through the pages in the report by either clicking on the pages listed below, or by using the keyword search tool below to find specific information within the annual report.-
 1
1 -
2
-
3
-
4
-
5
-
6
-
7
-
8
-
9
-
10
-
11
-
12
-
13
-
14
-
15
-
16
-
17
-
18
-
19
-
20
-
21
-
22
-
23
-
24
-
25
-
26
-
27
-
28
-
29
-
 30
30 -
 31
31 -
 32
32 -
 33
33 -
 34
34 -
 35
35 -
 36
36 -
 37
37 -
 38
38 -
 39
39 -
 40
40 -
 41
41 -
 42
42 -
 43
43 -
 44
44 -
 45
45 -
 46
46 -
 47
47 -
 48
48 -
 49
49 -
 50
50 -
51
-
52
-
53
-
54
-
55
-
56
-
57
-
58
-
59
-
60
-
61
-
62
-
63
-
64
-
65
-
66
-
67
 |
 |

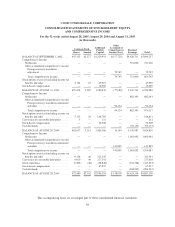
COSTCO WHOLESALE CORPORATION
CONSOLIDATED STATEMENTS OF CASH FLOWS
(dollars in thousands)
52 Weeks
Ended
August 28,
2005
52 Weeks
Ended
August 29,
2004
52 Weeks
Ended
August 31,
2003
CASH FLOWS FROM OPERATING ACTIVITIES
Net income .......................................................... $1,063,092 $ 882,393 $ 721,000
Adjustments to reconcile net income to net cash provided by operating activities:
Depreciation, amortization and other non-cash items ....................... 477,868 440,721 391,302
Accretion of discount on zero coupon notes .............................. 11,855 18,421 17,852
Stock-based compensation ............................................ 67,937 36,508 12,069
Undistributed equity earnings in joint ventures ............................ (26,459) (23,517) (21,612)
Net loss/(gain) on sale of property and equipment and other ................. 5,139 (9,122) 4,907
Provision for impaired assets .......................................... 3,893 2,592 4,697
Change in deferred income taxes ....................................... (64,690) 32,496 68,693
Tax benefit from exercise of stock options ............................... 44,946 22,712 12,348
Change in receivables, other current assets, deferred income, accrued and other
current liabilities .................................................. 33,172 740,027 232,167
Increase in merchandise inventories .................................... (315,793) (256,438) (162,759)
Increase in accounts payable .......................................... 482,217 211,990 226,544
Total adjustments ................................................. 720,085 1,216,390 786,208
Net cash provided by operating activities ................................ 1,783,177 2,098,783 1,507,208
CASH FLOWS FROM INVESTING ACTIVITIES
Additions to property and equipment ...................................... (995,431) (705,620) (810,665)
Proceeds from the sale of property and equipment ........................... 19,432 55,400 51,829
Investment in unconsolidated joint venture ................................. (15,000) — —
Purchase of minority interest ............................................ (3,961) (95,153) —
Purchases of short-term investments ...................................... (3,741,429) (387,223) —
Maturities of short-term investments ...................................... 2,401,248 — —
Sales of short-term investments .......................................... 267,640 83,278 —
Decrease/(increase) in other assets and other, net ............................ 8,772 837 (31,752)
Net cash used in investing activities .................................... (2,058,729) (1,048,481) (790,588)
CASH FLOWS FROM FINANCING ACTIVITIES
Proceeds from/(repayments of) short-term borrowings, net .................... 33,433 (31,492) (58,144)
Net proceeds from issuance of long-term debt ............................... 5,660 — 59,424
Repayments of long-term debt ........................................... (303,877) (6,602) (11,823)
Changes in bank checks outstanding ...................................... 85,829 212,251 (31,639)
Cash dividend payments ................................................ (204,567) (92,137) —
Changes in minority interests ............................................ (130) 2,805 6,087
Exercise of stock options ............................................... 278,253 124,744 34,667
Repurchases of common stock ........................................... (413,252) — —
Net cash (used in)/provided by financing activities ......................... (518,651) 209,569 (1,428)
EFFECT OF EXCHANGE RATE CHANGES ON CASH .................... 33,653 17,825 24,729
Net (decrease)/increase in cash and cash equivalents ......................... (760,550) 1,277,696 739,921
CASH AND CASH EQUIVALENTS BEGINNING OF YEAR ................ 2,823,135 1,545,439 805,518
CASH AND CASH EQUIVALENTS END OF YEAR ........................ $2,062,585 $ 2,823,135 $1,545,439
SUPPLEMENTAL DISCLOSURE OF CASH FLOW INFORMATION:
Cash paid during the year for:
Interest (excludes amounts capitalized) .................................. $ 21,374 $ 14,648 $ 20,861
Income taxes ....................................................... $ 804,957 $ 327,368 $ 320,546
The accompanying notes are an integral part of these consolidated financial statements.
39