Costco 2005 Annual Report Download - page 18
Download and view the complete annual report
Please find page 18 of the 2005 Costco annual report below. You can navigate through the pages in the report by either clicking on the pages listed below, or by using the keyword search tool below to find specific information within the annual report.-
 1
1 -
2
-
3
-
4
-
5
-
6
-
7
-
 8
8 -
 9
9 -
 10
10 -
 11
11 -
 12
12 -
 13
13 -
 14
14 -
 15
15 -
 16
16 -
 17
17 -
 18
18 -
 19
19 -
 20
20 -
 21
21 -
 22
22 -
 23
23 -
 24
24 -
 25
25 -
 26
26 -
 27
27 -
 28
28 -
29
-
30
-
31
-
32
-
33
-
34
-
35
-
36
-
37
-
38
-
39
-
40
-
41
-
42
-
43
-
44
-
45
-
46
-
47
-
48
-
49
-
50
-
51
-
52
-
53
-
54
-
55
-
56
-
57
-
58
-
59
-
60
-
61
-
62
-
63
-
64
-
65
-
66
-
67
 |
 |

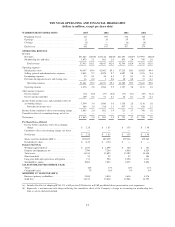
SELECTED CONSOLIDATED STATEMENTS OF INCOME DATA
The table below presents selected operational data, the percentage relationship between net sales and
major categories in the Consolidated Statements of Income and the percentage change in the dollar amounts
of each of the items.
Percent of Net Sales
Percentage Increase/(Decrease)
(of dollar amounts)
Fiscal 2005 Fiscal 2004 Fiscal 2003
Fiscal 2005
vs. Fiscal 2004
Fiscal 2004
vs. Fiscal 2003
Net sales ............................... 100.00% 100.00% 100.00% 10.0% 13.1%
Membership fees ........................ 2.07 2.04 2.05 11.6 12.7
Grossmargin(a) ......................... 10.63 10.72 10.69 9.1 13.4
Selling, general and administrative expenses . . . 9.73 9.75 9.83 9.7 12.2
Preopeningexpenses ..................... 0.10 0.07 0.09 74.8 (16.9)
Provision for impaired assets and closing costs,
net .................................. 0.03 — 0.05 1539.3 (94.9)
Operating income .................... 2.84 2.94 2.77 6.4 19.8
Interest expense ......................... (0.06) (0.08) (0.08) (6.0) (0.7)
Interest income and other .................. 0.21 0.11 0.09 111.3 34.0
Incomebeforeincometaxes............ 2.99 2.97 2.78 10.6 20.9
Provision for income taxes ............. 0.94 1.10 1.05 (6.2) 18.5
NetIncome ..................... 2.05% 1.87% 1.73% 20.5% 22.4%
(a) Defined as net sales less merchandise costs.
Comparison of Fiscal 2005 (52 weeks) and Fiscal 2004 (52 weeks):
(dollars in thousands, except earnings per share)
Net Income
Net income for fiscal 2005 increased 20.5% to $1,063,092, or $2.18 per diluted share, from $882,393, or
$1.85 per diluted share, during fiscal year 2004. Net income during fiscal 2005 was impacted by the following: a
$54,155 (approximately $.11 per diluted share) income tax benefit resulting primarily from the settlement of a
transfer pricing dispute between the United States and Canada (covering the years 1996-2003); a cumulative
pre-tax, non-cash charge to preopening expenses of $15,999 (approximately $.02 per diluted share) related to a
correction to the Company’s method of accounting for ground leases (entered into over the past twenty years)
that did not require rental payments during the period of construction; and a net tax benefit with respect to excess
foreign tax credits on unremitted foreign earnings recorded in the fourth quarter of $20,592 (approximately $.04
per diluted share). Exclusive of these items, net income for fiscal 2005 would have been $998,326 or $2.04 per
diluted share, a 10% increase in earnings per share over the prior fiscal year.
Net Sales
Net sales increased 10.0% to $51,862,072 in fiscal 2005 from $47,145,712 in fiscal 2004. Approximately
71% of the increase was due to an increase in comparable warehouse sales, that is sales in warehouses open for at
least a year. The balance of the increase was due to opening 16 new warehouses during fiscal 2005 and 20 new
warehouses during fiscal 2004, a portion of which is not included in comparable warehouse sales. Net sales were
reduced by the implementation of Emerging Issues Task Force (EITF) Issue No. 03-10, “Application of Issue
No. 02-16, “Accounting by a Customer (Including a Reseller) for Certain Consideration Received from a
17