Costco 2005 Annual Report Download - page 3
Download and view the complete annual report
Please find page 3 of the 2005 Costco annual report below. You can navigate through the pages in the report by either clicking on the pages listed below, or by using the keyword search tool below to find specific information within the annual report.-
 1
1 -
 2
2 -
 3
3 -
 4
4 -
 5
5 -
 6
6 -
 7
7 -
 8
8 -
 9
9 -
 10
10 -
 11
11 -
 12
12 -
 13
13 -
 14
14 -
15
-
16
-
17
-
18
-
19
-
20
-
21
-
22
-
23
-
24
-
25
-
26
-
27
-
28
-
29
-
30
-
31
-
32
-
33
-
34
-
35
-
36
-
37
-
38
-
39
-
40
-
41
-
42
-
43
-
44
-
45
-
46
-
47
-
48
-
49
-
50
-
51
-
52
-
53
-
54
-
55
-
56
-
57
-
58
-
59
-
60
-
61
-
62
-
63
-
64
-
65
-
66
-
67
 |
 |

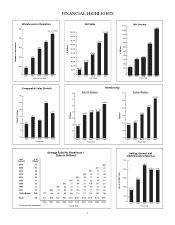
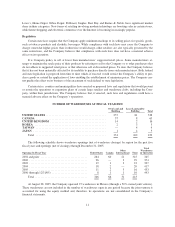
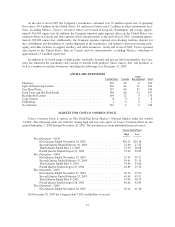
Warehouses in Operation
At Fiscal Year End
Number of Warehouses
450
425
2001 2002 2004
400
375
345
397
(443 at 12/31/05)
350
0
2005
417
433
2003
374
Net Sales
Fiscal Year
$ Millions
2001 2002 2004 2005
34,137
37,993
38,000
36,000
42,000
40,000
44,000
46,000
48,000
50,000
52,000
2003
41,693
47,146
51,862
34,000
0
Net Income
Fiscal Year
$ Millions
2001 2002 2004
1,100
0
1,000
1,050
850
900
950
600
800
650
700
750
602
721
2005
882
1,063
2003
700
Comparable Sales Growth
Fiscal Year
Percent Increase
2001 2002 2004 2005
10%
0%
2%
4%
6%
8%
10%
12%
7%
2003
5%
6%
4%
Average Sales Per Warehouse *
(Sales In Millions)
Fiscal Year
*First year sales annualized.
112
106
86
77
65
$57
$101
108
99
77
72
$57
$101
98
85
$65
58
$94
90
70
$50
$87
84
$56
$83
$77
$77
433Totals
2491996 & Before
1997 10
1998 17
1999 15
2000 21
2001 32
2002 29
2003 24
2004 20
162005
Whses*Opened # ofYear
117
113
97
82
77
63
$58
$103
121
115
105
86
85
72
62
$105
$67
132
124
120
91
98
84
77
$115
79
$72
2005
138
131
99
107
127
94
88
91
81
$63
Selling, General and
Administrative Expenses
Fiscal Year
Percent of Net Sales
2001 2002 2003
0
10.0%
9.75%
9.50%
9.25%
9.41%
9.17%
2004
9.83%
2005
9.75% 9.73%
9.0%
Fiscal Year
2001 2002 2004
4.636
4.358
4.2
4.4
4.6
4.8
5.0
5.2
0
2005
4.810
5.050
2003
4.476
Business Members
Fiscal Year
Millions
Millions
2001 2002 2004
12.737
14.984
0
14
16
13
15
18
17
2005
15.018
16.233
2003
14.597
Gold Star Members
Membership
12
FINANCIAL HIGHLIGHTS
1
2004
2002 2003
2001
1999 2000
1998
1996 1997
$120