Costco 2005 Annual Report Download - page 15
Download and view the complete annual report
Please find page 15 of the 2005 Costco annual report below. You can navigate through the pages in the report by either clicking on the pages listed below, or by using the keyword search tool below to find specific information within the annual report.-
 1
1 -
2
-
3
-
4
-
 5
5 -
 6
6 -
 7
7 -
 8
8 -
 9
9 -
 10
10 -
 11
11 -
 12
12 -
 13
13 -
 14
14 -
 15
15 -
 16
16 -
 17
17 -
 18
18 -
 19
19 -
 20
20 -
 21
21 -
 22
22 -
 23
23 -
 24
24 -
 25
25 -
26
-
27
-
28
-
29
-
30
-
31
-
32
-
33
-
34
-
35
-
36
-
37
-
38
-
39
-
40
-
41
-
42
-
43
-
44
-
45
-
46
-
47
-
48
-
49
-
50
-
51
-
52
-
53
-
54
-
55
-
56
-
57
-
58
-
59
-
60
-
61
-
62
-
63
-
64
-
65
-
66
-
67
 |
 |

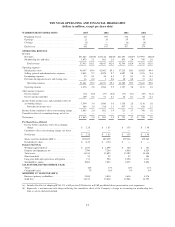
TEN YEAR OPERATING AND FINANCIAL HIGHLIGHTS
(dollars in millions, except per share data)
WAREHOUSES IN OPERATIONS 2005 2004 2003 2002
Beginningofyear ............................ 417 397 374 345
Openings ................................... 21 20 29 35
Closings.................................... (5) — (6) (6)
Endofyear ................................. 433 417 397 374
OPERATING RESULTS
Revenue
Net Sales ..................................... $51,862 100.0% $47,146 100.0% $41,693 100.0% $37,993 100.0%
Membership fees and other ....................... 1,073 2.1 961 2.0 853 2.0 769 2.0
Totalrevenue ............................... 52,935 102.1 48,107 102.0 42,546 102.0 38,762 102.0
Operating expenses
Merchandise costs .............................. 46,347 89.4 42,092 89.3 37,235 89.3 33,983 89.4
Selling, general and administrative expenses ......... 5,045 9.7 4,598 9.7 4,097 9.8 3,576 9.4
Preopeningexpenses............................ 53 0.1 30 0.1 37 0.1 51 0.1
Provision for impaired assets and closing costs ....... 16 0.0 1 0.0 20 0.0 21 0.1
Operating expenses ........................... 51,461 99.2 46,721 99.1 41,389 99.2 37,631 99.0
Operating income .............................. 1,474 2.8 1,386 2.9 1,157 2.8 1,131 3.0
Other income (expense)
Interest expense ................................ (34) (0.0) (37) (0.0) (37) (0.1) (29) (0.1)
Interest income and other ........................ 109 0.2 51 0.1 38 0.1 36 0.1
Income before income taxes and cumulative effect of
accountingchange.............................. 1,549 3.0 1,400 3.0 1,158 2.8 1,138 3.0
Provision for income taxes ..................... 486 1.0 518 1.1 437 1.1 438 1.2
Income before cumulative effect of accounting change . . . 1,063 2.0 882 1.9 721 1.7 700 1.8
Cumulative effect of accounting change, net of tax ...... — — — — — — — —
Netincome ..................................... $ 1,063 2.0 $ 882 1.9 $ 721 1.7 $ 700 1.8
Per Share Data—Diluted
Income before cumulative effect of accounting
change ................................... $ 2.18 $ 1.85 $ 1.53 $ 1.48
Cumulative effect of accounting change, net of tax . . — — — —
NetIncome ................................. $ 2.18 $ 1.85 $ 1.53 $ 1.48
Shares used in calculation (000’s) ............... 492,035 485,459 479,326 479,262
Dividendspershare........................... $ 0.43 $ 0.20 $ — $ —
Balance Sheet Data
Working capital (deficit) ....................... $ 1,477 $ 1,099 $ 700 $ 181
Property and equipment, net .................... 7,790 7,264 6,960 6,524
Total assets ................................. 16,514 15,093 13,192 11,620
Short-term debt .............................. 54 22 47 104
Long-term debt and capital lease obligations ....... 711 994 1,290 1,211
Stockholders’ equity .......................... 8,881 7,625 6,555 5,694
SALES INCREASE FROM PRIOR YEAR
Total ...................................... 10% 13% 10% 11%
Comparable units ............................ 7% 10% 5% 6%
MEMBERS AT YEAR END (000’S)
Business (primary cardholders) ................. 5,050 4,810 4,636 4,476
GoldStar ................................... 16,233 15,018 14,984 14,597
(a) Includes the effect of adopting SFAS 121, a $65 pre-tax ($39 after-tax or $0.09 pre diluted share) provision for asset impairment.
(b) Represents a one-time non-cash charge reflecting the cumulative effect of the Company’s change in accounting for membership fees
from a cash to a deferred method.
14