Columbia Sportswear 2013 Annual Report Download - page 70
Download and view the complete annual report
Please find page 70 of the 2013 Columbia Sportswear annual report below. You can navigate through the pages in the report by either clicking on the pages listed below, or by using the keyword search tool below to find specific information within the annual report.-
 1
1 -
2
-
3
-
4
-
5
-
6
-
7
-
8
-
9
-
10
-
11
-
12
-
13
-
14
-
15
-
16
-
17
-
18
-
19
-
20
-
21
-
22
-
23
-
24
-
25
-
26
-
27
-
28
-
29
-
30
-
31
-
32
-
33
-
34
-
35
-
36
-
37
-
38
-
39
-
40
-
41
-
42
-
43
-
44
-
45
-
46
-
47
-
48
-
49
-
50
-
51
-
52
-
53
-
54
-
55
-
56
-
57
-
58
-
59
-
 60
60 -
 61
61 -
 62
62 -
 63
63 -
 64
64 -
 65
65 -
 66
66 -
 67
67 -
 68
68 -
 69
69 -
 70
70 -
 71
71 -
 72
72 -
 73
73 -
 74
74 -
 75
75 -
 76
76 -
 77
77 -
 78
78 -
 79
79 -
 80
80 -
81
-
82
-
83
-
84
 |
 |

COLUMBIA SPORTSWEAR COMPANY
NOTES TO CONSOLIDATED FINANCIAL STATEMENTS—(Continued)
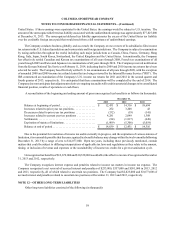
66
Unrealized
gains (losses)
on available for
sale securities
Unrealized holding
gains (losses) on
derivative
transactions
Foreign
currency
translation
adjustments Total
Balance at January 1, 2011. . . . . . . . . . . . . . . . . . . . . . . . . . . $ 36 $ (1,671) $ 48,350 $ 46,715
Other comprehensive income (loss) before reclassifications . (38) 3,489 (8,701) (5,250)
Amounts reclassified from other comprehensive income . . . — 5,432 — 5,432
Net other comprehensive income (loss) during the period. . . (38) 8,921 (8,701) 182
Balance at December 31, 2011. . . . . . . . . . . . . . . . . . . . . . . . (2) 7,250 39,649 46,897
Other comprehensive income (loss) before reclassifications . (7) 753 4,518 5,264
Amounts reclassified from other comprehensive income . . . — (5,498) — (5,498)
Net other comprehensive income (loss) during the period. . . (7) (4,745) 4,518 (234)
Balance at December 31, 2012. . . . . . . . . . . . . . . . . . . . . . . . (9) 2,505 44,167 46,663
Other comprehensive income (loss) before reclassifications . 3 2,779 (10,045) (7,263)
Amounts reclassified from other comprehensive income . . . — (4,040) — (4,040)
Net other comprehensive income (loss) during the period. . . 3 (1,261) (10,045) (11,303)
Balance at December 31, 2013. . . . . . . . . . . . . . . . . . . . . . . . $(6) $ 1,244 $ 34,122 $ 35,360
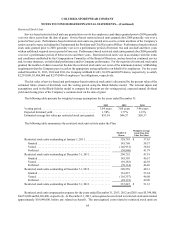
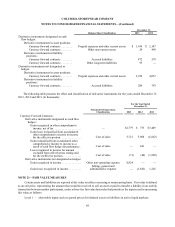
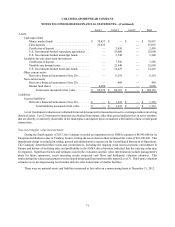
All reclassification adjustments related to derivative transactions are recorded in cost of sales on the Consolidated
Statements of Operations. See Note 20 for further information regarding derivative instrument reclassification adjustments.
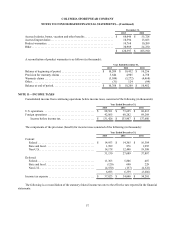
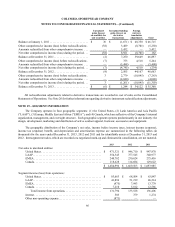
NOTE 19—SEGMENT INFORMATION
The Company operates in four geographic segments: (1) the United States, (2) Latin America and Asia Pacific
(“LAAP”), (3) Europe, Middle East and Africa (“EMEA”), and (4) Canada, which are reflective of the Company’s internal
organization, management, and oversight structure. Each geographic segment operates predominantly in one industry: the
design, development, marketing and distribution of active outdoor apparel, footwear, accessories and equipment.
The geographic distribution of the Company’s net sales, income before income taxes, interest income (expense),
income tax (expense) benefit, and depreciation and amortization expense are summarized in the following tables (in
thousands) for the years ended December 31, 2013, 2012 and 2011 and for identifiable assets at December 31, 2013 and
2012. Intersegment net sales, which are recorded at a negotiated mark-up and eliminated in consolidation, are not material.
2013 2012 2011
Net sales to unrelated entities:
United States . . . . . . . . . . . . . . . . . . . . . . . . . . . . . . . . . . . . . . . . . . $ 971,321 $ 946,710 $ 947,970
LAAP. . . . . . . . . . . . . . . . . . . . . . . . . . . . . . . . . . . . . . . . . . . . . . . . 354,345 377,545 340,977
EMEA . . . . . . . . . . . . . . . . . . . . . . . . . . . . . . . . . . . . . . . . . . . . . . . 240,702 230,624 275,416
Canada. . . . . . . . . . . . . . . . . . . . . . . . . . . . . . . . . . . . . . . . . . . . . . . 118,628 114,684 129,622
$ 1,684,996 $ 1,669,563 $ 1,693,985
Segment income (loss) from operations:
United States . . . . . . . . . . . . . . . . . . . . . . . . . . . . . . . . . . . . . . . . . . $ 83,663 $ 68,504 $ 63,847
LAAP. . . . . . . . . . . . . . . . . . . . . . . . . . . . . . . . . . . . . . . . . . . . . . . . 41,896 51,219 46,214
EMEA . . . . . . . . . . . . . . . . . . . . . . . . . . . . . . . . . . . . . . . . . . . . . . . (975) 7,993 13,779
Canada. . . . . . . . . . . . . . . . . . . . . . . . . . . . . . . . . . . . . . . . . . . . . . . 7,210 5,812 12,566
Total income from operations. . . . . . . . . . . . . . . . . . . . . . . . . . 131,794 133,528 136,406
Interest. . . . . . . . . . . . . . . . . . . . . . . . . . . . . . . . . . . . . . . . . . . . . . . 503 379 1,274
Other non-operating expense. . . . . . . . . . . . . . . . . . . . . . . . . . . . . . (871) — —