Columbia Sportswear 2013 Annual Report Download - page 51
Download and view the complete annual report
Please find page 51 of the 2013 Columbia Sportswear annual report below. You can navigate through the pages in the report by either clicking on the pages listed below, or by using the keyword search tool below to find specific information within the annual report.-
 1
1 -
2
-
3
-
4
-
5
-
6
-
7
-
8
-
9
-
10
-
11
-
12
-
13
-
14
-
15
-
16
-
17
-
18
-
19
-
20
-
21
-
22
-
23
-
24
-
25
-
26
-
27
-
28
-
29
-
30
-
31
-
32
-
33
-
34
-
35
-
36
-
37
-
38
-
39
-
40
-
 41
41 -
 42
42 -
 43
43 -
 44
44 -
 45
45 -
 46
46 -
 47
47 -
 48
48 -
 49
49 -
 50
50 -
 51
51 -
 52
52 -
 53
53 -
 54
54 -
 55
55 -
 56
56 -
 57
57 -
 58
58 -
 59
59 -
 60
60 -
 61
61 -
62
-
63
-
64
-
65
-
66
-
67
-
68
-
69
-
70
-
71
-
72
-
73
-
74
-
75
-
76
-
77
-
78
-
79
-
80
-
81
-
82
-
83
-
84
 |
 |

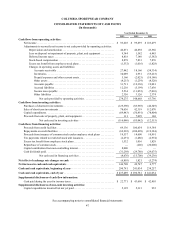
COLUMBIA SPORTSWEAR COMPANY
See accompanying notes to consolidated financial statements
47
CONSOLIDATED STATEMENTS OF CASH FLOWS
(In thousands)
Year Ended December 31,
2013 2012 2011
Cash flows from operating activities:
Net income . . . . . . . . . . . . . . . . . . . . . . . . . . . . . . . . . . . . . . . . . . . . . . . . . . . . . . . . . $ 93,603 $ 99,859 $ 103,479
Adjustments to reconcile net income to net cash provided by operating activities:
Depreciation and amortization . . . . . . . . . . . . . . . . . . . . . . . . . . . . . . . . . . . . . . 40,871 40,892 43,560
Loss on disposal or impairment of property, plant, and equipment . . . . . . . . . . 9,344 1,582 6,485
Deferred income taxes . . . . . . . . . . . . . . . . . . . . . . . . . . . . . . . . . . . . . . . . . . . . 8,818 7,140 (3,582)
Stock-based compensation . . . . . . . . . . . . . . . . . . . . . . . . . . . . . . . . . . . . . . . . . 8,878 7,833 7,870
Excess tax benefit from employee stock plans . . . . . . . . . . . . . . . . . . . . . . . . . . (1,532) (1,016) (1,828)
Changes in operating assets and liabilities:
Accounts receivable . . . . . . . . . . . . . . . . . . . . . . . . . . . . . . . . . . . . . . . . . . 27,442 18,166 (54,334)
Inventories. . . . . . . . . . . . . . . . . . . . . . . . . . . . . . . . . . . . . . . . . . . . . . . . . . 34,089 2,951 (55,223)
Prepaid expenses and other current assets. . . . . . . . . . . . . . . . . . . . . . . . . . 5,166 (2,025) (10,186)
Other assets . . . . . . . . . . . . . . . . . . . . . . . . . . . . . . . . . . . . . . . . . . . . . . . . . (4,215) (1,259) (4,520)
Accounts payable . . . . . . . . . . . . . . . . . . . . . . . . . . . . . . . . . . . . . . . . . . . . 31,711 (12,330) 19,081
Accrued liabilities . . . . . . . . . . . . . . . . . . . . . . . . . . . . . . . . . . . . . . . . . . . . 12,210 (5,199) 17,630
Income taxes payable . . . . . . . . . . . . . . . . . . . . . . . . . . . . . . . . . . . . . . . . . 5,534 (11,052) (7,010)
Other liabilities . . . . . . . . . . . . . . . . . . . . . . . . . . . . . . . . . . . . . . . . . . . . . . 2,356 3,126 2,374
Net cash provided by operating activities . . . . . . . . . . . . . . . . . . . . . . 274,275 148,668 63,796
Cash flows from investing activities:
Purchases of short-term investments . . . . . . . . . . . . . . . . . . . . . . . . . . . . . . . . . . . . . (125,390) (83,969) (46,349)
Sales of short-term investments . . . . . . . . . . . . . . . . . . . . . . . . . . . . . . . . . . . . . . . . . 78,636 42,319 112,070
Capital expenditures. . . . . . . . . . . . . . . . . . . . . . . . . . . . . . . . . . . . . . . . . . . . . . . . . . (69,443) (50,491) (78,404)
Proceeds from sale of property, plant, and equipment. . . . . . . . . . . . . . . . . . . . . . . . 111 7,099 168
Net cash used in investing activities . . . . . . . . . . . . . . . . . . . . . . . . . . (116,086) (85,042) (12,515)
Cash flows from financing activities:
Proceeds from credit facilities . . . . . . . . . . . . . . . . . . . . . . . . . . . . . . . . . . . . . . . . . . 69,136 100,654 119,384
Repayments on credit facilities . . . . . . . . . . . . . . . . . . . . . . . . . . . . . . . . . . . . . . . . . (69,292) (100,498) (119,384)
Proceeds from issuance of common stock under employee stock plans . . . . . . . . . . 19,537 14,600 10,991
Tax payments related to restricted stock unit issuances. . . . . . . . . . . . . . . . . . . . . . . (2,291) (1,486) (2,974)
Excess tax benefit from employee stock plans. . . . . . . . . . . . . . . . . . . . . . . . . . . . . . 1,532 1,016 1,828
Repurchase of common stock. . . . . . . . . . . . . . . . . . . . . . . . . . . . . . . . . . . . . . . . . . . — (206) (20,000)
Capital contribution from non-controlling interest. . . . . . . . . . . . . . . . . . . . . . . . . . . 8,000 — —
Cash dividends paid . . . . . . . . . . . . . . . . . . . . . . . . . . . . . . . . . . . . . . . . . . . . . . . . . . (31,298) (29,780) (29,075)
Net cash used in financing activities . . . . . . . . . . . . . . . . . . . . . . . . . . (4,676) (15,700) (39,230)
Net effect of exchange rate changes on cash . . . . . . . . . . . . . . . . . . . . . . . . . . . . . . . . . (6,805) 1,821 (5,274)
Net increase in cash and cash equivalents . . . . . . . . . . . . . . . . . . . . . . . . . . . . . . . . . . . 146,708 49,747 6,777
Cash and cash equivalents, beginning of year. . . . . . . . . . . . . . . . . . . . . . . . . . . . . . . . 290,781 241,034 234,257
Cash and cash equivalents, end of year . . . . . . . . . . . . . . . . . . . . . . . . . . . . . . . . . . . . . $ 437,489 $ 290,781 $ 241,034
Supplemental disclosures of cash flow information:
Cash paid during the year for income taxes . . . . . . . . . . . . . . . . . . . . . . . . . . . . . . . . $ 22,771 $ 43,696 $ 42,405
Supplemental disclosures of non-cash investing activities:
Capital expenditures incurred but not yet paid. . . . . . . . . . . . . . . . . . . . . . . . . . . . . . 5,195 5,313 952