Columbia Sportswear 2013 Annual Report Download - page 37
Download and view the complete annual report
Please find page 37 of the 2013 Columbia Sportswear annual report below. You can navigate through the pages in the report by either clicking on the pages listed below, or by using the keyword search tool below to find specific information within the annual report.-
 1
1 -
2
-
3
-
4
-
5
-
6
-
7
-
8
-
9
-
10
-
11
-
12
-
13
-
14
-
15
-
16
-
17
-
18
-
19
-
20
-
21
-
22
-
23
-
24
-
25
-
26
-
 27
27 -
 28
28 -
 29
29 -
 30
30 -
 31
31 -
 32
32 -
 33
33 -
 34
34 -
 35
35 -
 36
36 -
 37
37 -
 38
38 -
 39
39 -
 40
40 -
 41
41 -
 42
42 -
 43
43 -
 44
44 -
 45
45 -
 46
46 -
 47
47 -
48
-
49
-
50
-
51
-
52
-
53
-
54
-
55
-
56
-
57
-
58
-
59
-
60
-
61
-
62
-
63
-
64
-
65
-
66
-
67
-
68
-
69
-
70
-
71
-
72
-
73
-
74
-
75
-
76
-
77
-
78
-
79
-
80
-
81
-
82
-
83
-
84
 |
 |
33
Our gross profit may not be comparable to those of other companies in our industry because some of these companies
include all of the costs related to their distribution network in cost of sales while we, like many others, include these expenses
as a component of SG&A expense.
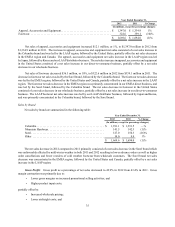
Selling, General and Administrative Expense: SG&A expense includes all costs associated with our design,
merchandising, marketing, distribution and corporate functions, including related depreciation and amortization.
SG&A expense increased $29.1 million, or 5%, to $625.7 million, or 37.1% of net sales, in 2013, from $596.6 million,
or 35.7% of net sales, in 2012. The SG&A expense increase was primarily due to:
• The expansion of direct-to-consumer operations globally;
• Increased incentive compensation; and
• Higher impairment charges resulting from the write-down in 2013 of our Europe distribution center;
partially offset by:
• Favorable foreign currency exchange rates; and
• Decreased operating costs in our Europe operations.
Depreciation and amortization included in SG&A expense totaled $39.6 million in 2013, compared to $39.9 million
in 2012.
Net Licensing Income: Net licensing income was flat at $13.8 million in both 2013 and 2012. Increases in domestic
licensing income were offset by a decrease in LAAP licensing income due to the deferral of 2013 licensing income that
will be recognized in gross profit in future periods beginning in 2014 in connection with our transition to the China joint
venture.
Interest Income, Net: Net interest income was $0.5 million in 2013, compared to $0.4 million in 2012. The increase
in interest income was primarily driven by higher average cash and investment balances, partially offset by lower average
interest rates during 2013 compared to 2012. Interest expense was nominal in both 2013 and 2012.
Income Tax Expense: Income tax expense increased to $37.8 million in 2013 from $34.0 million in 2012. Our
effective income tax rate increased to 28.8% from 25.4% in 2012, primarily due to changes in the geographic mix of income
and decreased tax benefits from the resolution of uncertain tax positions.
Net Income attributable to Columbia Sportswear Company: Net income decreased $5.6 million, or 6%, to $94.3
million in 2013, including an impairment charge of approximately $5.6 million, net of tax, from $99.9 million in 2012.
Diluted earnings per share was $2.72 in 2013, including an impairment charge of $0.16 per share, net of tax, compared to
$2.93 in 2012.
Year Ended December 31, 2012 Compared to Year Ended December 31, 2011
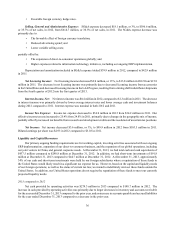
Net Sales: Consolidated net sales decreased $24.4 million, or 1%, to $1,669.6 million in 2012 from $1,694.0 million
in 2011. Changes in foreign currency exchange rates compared with 2011 negatively affected the net sales comparison by
approximately one percentage point.
Sales by Geographic Region
Net sales by geographic region are summarized in the following table: