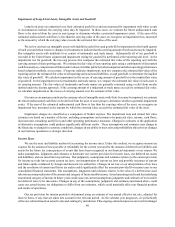
Columbia Sportswear 2013 Annual Report Download - page 34
Download and view the complete annual report
Please find page 34 of the 2013 Columbia Sportswear annual report below. You can navigate through the pages in the report by either clicking on the pages listed below, or by using the keyword search tool below to find specific information within the annual report.
30
The following discussion of our results of operations and liquidity and capital resources should be read in conjunction
with the Consolidated Financial Statements and accompanying Notes that appear elsewhere in this annual report. All
references to years relate to the calendar year ended December 31.
Highlights of the Year Ended December 31, 2013
• Net sales increased $15.4 million, or 1%, to $1,685.0 million in 2013 from $1,669.6 million in 2012. Changes
in foreign currency exchange rates compared with 2012 negatively affected the consolidated net sales comparison
by approximately one percentage point.
• Net income attributable to Columbia Sportswear Company decreased 6% to $94.3 million in 2013, including
an impairment charge of approximately $5.6 million, net of tax, from $99.9 million in 2012, and diluted earnings
per share decreased to $2.72 in 2013, including an impairment charge of $0.16 per share, net of tax, compared
to $2.93 in 2012.
• We paid cash dividends totaling $31.3 million, or $0.91 per share, in 2013.
Our previously announced joint venture in mainland China with Swire commenced operations effective January 1,
2014. As a majority-owned entity, the joint venture's operations are included in our consolidated financial results. During
2013, our financial results were affected as we transitioned to the joint venture from our previous third-party distributor
relationship with Swire. We funded our initial capital contribution of $12.0 million in cash and Swire funded its initial
capital contribution of $8.0 million in cash to the joint venture during the second quarter of 2013. Additional capital will
be provided in the first quarter of 2014 in the form of proportionate shareholder loans totaling up to $40 million. We incurred
approximately $3.7 million of organizational and other pre-operating costs, including personnel costs, professional fees and
selling-related expenses, during 2013. Our shipments of spring 2014 inventory for the China market, which began in the
fourth quarter of 2013, were sold directly to the joint venture entity. The related sales, gross margin, and licensing income,
which we would have recognized in the fourth quarter of 2013 under the historical distributor model, were deferred and
will be recognized in future periods as the joint venture sells that inventory to wholesale customers and consumers. As of
December 31, 2013, inventory of spring 2014 and prior seasons, totaling $20.6 million, was acquired by the joint venture.
During 2013, we deferred gross profit and licensing income related to this inventory totaling $4.9 million, which we will
recognize in future periods as the inventory is sold by the joint venture to wholesale customers and consumers. The effects
of these deferrals have been included in our 2013 operating results.
The following table sets forth, for the periods indicated, the percentage relationship to net sales of specified items
in our Consolidated Statements of Operations:
Year Ended December 31,
2013 2012 2011
Net sales . . . . . . . . . . . . . . . . . . . . . . . . . . . . . . . . . . . . . . . . . . . . . . . . . 100.0% 100.0% 100.0%
Cost of sales . . . . . . . . . . . . . . . . . . . . . . . . . . . . . . . . . . . . . . . . . . . . . . 55.9 57.1 56.6
Gross profit. . . . . . . . . . . . . . . . . . . . . . . . . . . . . . . . . . . . . . . . . . . . . . . 44.1 42.9 43.4
Selling, general and administrative expense. . . . . . . . . . . . . . . . . . . . . . 37.1 35.7 36.3
Net licensing income . . . . . . . . . . . . . . . . . . . . . . . . . . . . . . . . . . . . . . . 0.8 0.8 1.0
Income from operations . . . . . . . . . . . . . . . . . . . . . . . . . . . . . . . . . . . . . 7.8 8.0 8.1
Interest income, net. . . . . . . . . . . . . . . . . . . . . . . . . . . . . . . . . . . . . . . . . — — —
Other non-operating expense . . . . . . . . . . . . . . . . . . . . . . . . . . . . . . . . . — — —
Income before income tax . . . . . . . . . . . . . . . . . . . . . . . . . . . . . . . . . . . 7.8 8.0 8.1
Income tax expense. . . . . . . . . . . . . . . . . . . . . . . . . . . . . . . . . . . . . . . . . (2.2) (2.0) (2.0)
Net income . . . . . . . . . . . . . . . . . . . . . . . . . . . . . . . . . . . . . . . . . . . . . . . 5.6 6.0 6.1
Net loss attributable to non-controlling interest . . . . . . . . . . . . . . . . . . . — — —
Net income attributable to Columbia Sportswear Company . . . . . . . . . 5.6% 6.0% 6.1%
Year Ended December 31, 2013 Compared to Year Ended December 31, 2012


