Columbia Sportswear 2013 Annual Report Download - page 67
Download and view the complete annual report
Please find page 67 of the 2013 Columbia Sportswear annual report below. You can navigate through the pages in the report by either clicking on the pages listed below, or by using the keyword search tool below to find specific information within the annual report.-
 1
1 -
2
-
3
-
4
-
5
-
6
-
7
-
8
-
9
-
10
-
11
-
12
-
13
-
14
-
15
-
16
-
17
-
18
-
19
-
20
-
21
-
22
-
23
-
24
-
25
-
26
-
27
-
28
-
29
-
30
-
31
-
32
-
33
-
34
-
35
-
36
-
37
-
38
-
39
-
40
-
41
-
42
-
43
-
44
-
45
-
46
-
47
-
48
-
49
-
50
-
51
-
52
-
53
-
54
-
55
-
56
-
 57
57 -
 58
58 -
 59
59 -
 60
60 -
 61
61 -
 62
62 -
 63
63 -
 64
64 -
 65
65 -
 66
66 -
 67
67 -
 68
68 -
 69
69 -
 70
70 -
 71
71 -
 72
72 -
 73
73 -
 74
74 -
 75
75 -
 76
76 -
 77
77 -
78
-
79
-
80
-
81
-
82
-
83
-
84
 |
 |

COLUMBIA SPORTSWEAR COMPANY
NOTES TO CONSOLIDATED FINANCIAL STATEMENTS—(Continued)
63
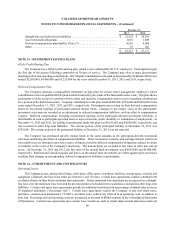
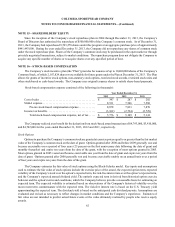
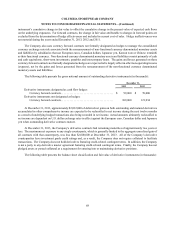
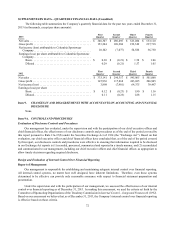
The following table presents the weighted average assumptions for the years ended December 31:
2013 2012 2011 (1)
Expected term . . . . . . . . . . . . . . . . . . . . . . . . . . . . . . . . . . . . . . . . . . . . . . 4.70 years 4.78 years 5.12 years
Expected stock price volatility . . . . . . . . . . . . . . . . . . . . . . . . . . . . . . . . . 30.53% 32.20% 30.76%
Risk-free interest rate . . . . . . . . . . . . . . . . . . . . . . . . . . . . . . . . . . . . . . . . 0.71% 0.88% 1.84%
Expected dividend yield . . . . . . . . . . . . . . . . . . . . . . . . . . . . . . . . . . . . . . 1.62% 1.80% 1.31%
Weighted average grant date fair value. . . . . . . . . . . . . . . . . . . . . . . . . . . $12.36 $11.57 $16.09
—————
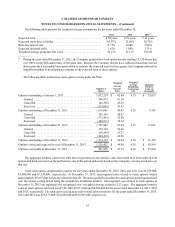
(1) During the year ended December 31, 2011, the Company granted two stock option awards totaling 53,720 shares that
vest 100% on the fifth anniversary of the grant date. Because the Company did not have sufficient historical exercise
data to provide a reasonable basis upon which to estimate the expected term for these grants, the Company utilized the
simplified method in developing an estimate of the expected term of these options.
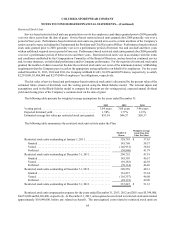
The following table summarizes stock option activity under the Plan:
Number of
Shares
Weighted
Average
Exercise
Price
Weighted
Average
Remaining
Contractual
Life
Aggregate
Intrinsic
Value (in
thousands)
Options outstanding at January 1, 2011 . . . . . . . . . . . . . . . . . . . . 1,872,214 $ 42.84 6.33 $ 33,057
Granted . . . . . . . . . . . . . . . . . . . . . . . . . . . . . . . . . . . . . . . . . 340,973 61.38
Cancelled. . . . . . . . . . . . . . . . . . . . . . . . . . . . . . . . . . . . . . . . (40,396) 43.68
Exercised. . . . . . . . . . . . . . . . . . . . . . . . . . . . . . . . . . . . . . . . (253,695) 43.32
Options outstanding at December 31, 2011 . . . . . . . . . . . . . . . . . 1,919,096 46.05 6.25 9,141
Granted . . . . . . . . . . . . . . . . . . . . . . . . . . . . . . . . . . . . . . . . . 358,169 48.82
Cancelled. . . . . . . . . . . . . . . . . . . . . . . . . . . . . . . . . . . . . . . . (172,465) 52.90
Exercised. . . . . . . . . . . . . . . . . . . . . . . . . . . . . . . . . . . . . . . . (380,811) 38.34
Options outstanding at December 31, 2012 . . . . . . . . . . . . . . . . . 1,723,989 47.64 6.15 13,001
Granted . . . . . . . . . . . . . . . . . . . . . . . . . . . . . . . . . . . . . . . . . 354,110 54.66
Cancelled. . . . . . . . . . . . . . . . . . . . . . . . . . . . . . . . . . . . . . . . (59,549) 53.33
Exercised. . . . . . . . . . . . . . . . . . . . . . . . . . . . . . . . . . . . . . . . (444,418) 43.96
Options outstanding at December 31, 2013 . . . . . . . . . . . . . . . . . 1,574,132 $ 50.04 6.36 $ 45,187
Options vested and expected to vest at December 31, 2013 . . . . 1,520,425 $ 49.90 6.28 $ 43,859
Options exercisable at December 31, 2013 . . . . . . . . . . . . . . . . . 821,859 $ 47.15 4.66 $ 25,969
The aggregate intrinsic value in the table above represents pre-tax intrinsic value that would have been realized if all
options had been exercised on the last business day of the period indicated, based on the Company’s closing stock price on
that day.
Total stock option compensation expense for the years ended December 31, 2013, 2012 and 2011 was $3,479,000,
$3,180,000 and $3,550,000, respectively. At December 31, 2013, unrecognized costs related to stock options totaled
approximately $5,637,000, before any related tax benefit. The unrecognized costs related to stock options are being amortized
over the related vesting period using the straight-line attribution method. Unrecognized costs related to stock options at
December 31, 2013 are expected to be recognized over a weighted average period of 2.23 years. The aggregate intrinsic
value of stock options exercised was $7,491,000, $5,517,000 and $4,906,000 for the years ended December 31, 2013, 2012
and 2011, respectively. The total cash received as a result of stock option exercises for the years ended December 31, 2013,
2012 and 2011 was $19,537,000, $14,600,000 and $10,991,000, respectively.