Columbia Sportswear 2004 Annual Report Download - page 47
Download and view the complete annual report
Please find page 47 of the 2004 Columbia Sportswear annual report below. You can navigate through the pages in the report by either clicking on the pages listed below, or by using the keyword search tool below to find specific information within the annual report.-
 1
1 -
2
-
3
-
4
-
5
-
6
-
7
-
8
-
9
-
10
-
11
-
12
-
13
-
14
-
15
-
16
-
17
-
18
-
19
-
20
-
21
-
22
-
23
-
24
-
25
-
26
-
27
-
28
-
29
-
30
-
31
-
32
-
33
-
34
-
35
-
36
-
 37
37 -
 38
38 -
 39
39 -
 40
40 -
 41
41 -
 42
42 -
 43
43 -
 44
44 -
 45
45 -
 46
46 -
 47
47 -
 48
48 -
 49
49 -
 50
50 -
 51
51 -
 52
52 -
 53
53 -
 54
54 -
 55
55 -
 56
56 -
 57
57 -
58
-
59
-
60
-
61
-
62
-
63
-
64
-
65
-
66
-
67
-
68
-
69
-
70
-
71
 |
 |

COLUMBIA SPORTSWEAR COMPANY
NOTES TO CONSOLIDATED FINANCIAL STATEMENTS—(Continued)
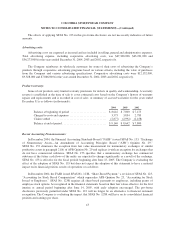
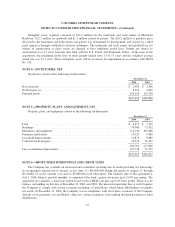
Fair value of financial instruments:
Based on borrowing rates currently available to the Company for bank loans with similar terms and
maturities, the fair value of the Company’s long-term debt approximates the carrying value. Furthermore, the
carrying value of all other financial instruments potentially subject to valuation risk (principally consisting of
cash and cash equivalents, short-term investments, accounts receivable and accounts payable) also approximate
fair value because of their short-term maturities.
Derivatives:
The Company accounts for derivatives in accordance with SFAS No. 133, “Accounting for Derivative
Instruments and Hedging Activities,” as amended.
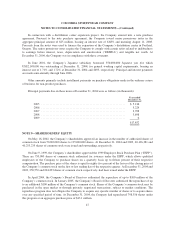
Substantially all foreign currency derivatives entered into by the Company qualify for and are designated as
foreign-currency cash flow hedges, including those hedging foreign currency denominated firm commitments.
Changes in fair values of outstanding cash flow hedge derivatives that are highly effective are recorded in
other comprehensive income, until earnings are affected by the variability of cash flows of the hedged
transaction. In most cases amounts recorded in other comprehensive income will be released to earnings some
time after maturity of the related derivative. The consolidated statement of operations classification of effective
hedge results is the same as that of the underlying exposure. Results of hedges of product costs are recorded in
cost of sales when the underlying hedged transaction affects earnings. Unrealized derivative gains and losses
recorded in current assets and liabilities and amounts recorded in other comprehensive income are non-cash
items and therefore are taken into account in the preparation of the consolidated statement of cash flows based on
their respective balance sheet classifications.
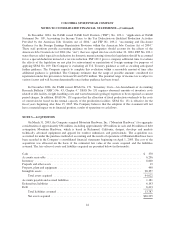
Stock-based compensation:
The Company has elected to follow the accounting provisions of Accounting Principles Board Opinion
No. 25 (“APB 25”), “Accounting for Stock Issued to Employees”, for stock-based compensation and to furnish
the pro forma disclosures required under SFAS No. 148, “Accounting for Stock-Based Compensation—
Transition and Disclosure.” No stock-based employee compensation cost is reflected in net income because all
options granted under those plans had an exercise price equal to the market value of the underlying common
stock on the date of the grant.
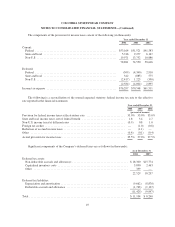
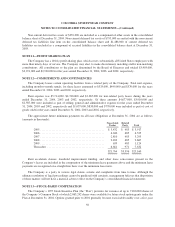
The following table illustrates the effect on net income and earnings per share if the Company had applied
the fair value recognition provisions of SFAS No. 123 to stock-based compensation (in thousands, except per
share amounts):
2004 2003 2002
Net income, as reported ........................................... $138,624 $120,121 $102,518
Add: Stock-based employee compensation expense included in reported
netincome,netoftax ....................................... — — —
Deduct: Total stock-based employee compensation expense determined
under fair value based method for all awards, net of tax ............ 9,277 8,585 6,611
Proformanetincome ............................................. $129,347 $111,536 $ 95,907
Earnings per share—basic
As reported ................................................. $ 3.44 $ 3.01 $ 2.60
Proforma .................................................. 3.21 2.79 2.43
Earnings per share—diluted
As reported ................................................. $ 3.40 $ 2.96 $ 2.56
Proforma .................................................. 3.17 2.75 2.39
42