Columbia Sportswear 2004 Annual Report Download - page 21
Download and view the complete annual report
Please find page 21 of the 2004 Columbia Sportswear annual report below. You can navigate through the pages in the report by either clicking on the pages listed below, or by using the keyword search tool below to find specific information within the annual report.-
 1
1 -
2
-
3
-
4
-
5
-
6
-
7
-
8
-
9
-
10
-
 11
11 -
 12
12 -
 13
13 -
 14
14 -
 15
15 -
 16
16 -
 17
17 -
 18
18 -
 19
19 -
 20
20 -
 21
21 -
 22
22 -
 23
23 -
 24
24 -
 25
25 -
 26
26 -
 27
27 -
 28
28 -
 29
29 -
 30
30 -
 31
31 -
32
-
33
-
34
-
35
-
36
-
37
-
38
-
39
-
40
-
41
-
42
-
43
-
44
-
45
-
46
-
47
-
48
-
49
-
50
-
51
-
52
-
53
-
54
-
55
-
56
-
57
-
58
-
59
-
60
-
61
-
62
-
63
-
64
-
65
-
66
-
67
-
68
-
69
-
70
-
71
 |
 |

• For the year, gross profit decreased 80 basis points to 45.5% in 2004 from 46.3% in 2003. The decrease was
primarily the result of a shift in sales product mix both between and within our product categories. Partially
offsetting the unfavorable effects of the shift in sales product mix was the favorable effect of fluctuations in
foreign currency exchange rates as foreign currencies in our direct international markets strengthened in
relation to the U.S. dollar.
• Selling, general and administrative expenses were flat as a percentage of net sales at 26.5% in both 2004 and
2003. In 2005, we anticipate SG&A expense will increase as a percentage of net sales, primarily due to the
operating costs associated with our new distribution center in Kentucky as well as incremental personnel
costs needed to support our growth strategies. We expect that depreciation and amortization will increase to
$25 million in 2005 as we place new distribution capital investments in service.
• Net income increased 15.4% to $138.6 million compared to 2003, and diluted earnings per share increased
to $3.40.
• In April 2004, our Board of Directors authorized a stock repurchase plan of up to $100 million of our
common stock. During 2004, we purchased approximately 798,300 shares of our common stock for $43.1
million. In January 2005, our Board of Directors authorized the repurchase of an additional $100 million of
our common stock. The repurchase program does not obligate us to acquire any specific number of shares or
acquire shares over any specified period of time.
Results of Operations
Net income increased $18.5 million, or 15.4%, to $138.6 million in 2004 from $120.1 million in 2003.
Diluted earnings per share increased $0.44 to $3.40 in 2004 from $2.96 in 2003. Net income increased $17.6
million, or 17.2%, to $120.1 million in 2003 from $102.5 million in 2002. Diluted earnings per share increased
$0.40 to $2.96 in 2003 from $2.56 in 2002.
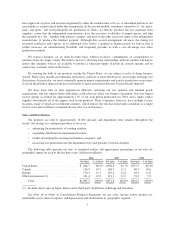
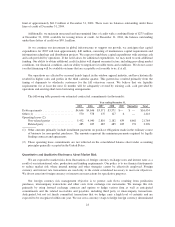
The following table sets forth, for the periods indicated, the percentage relationship to net sales of specified
items in our consolidated statements of operations:
2004 2003 2002
Net sales .............................................................. 100.0% 100.0% 100.0%
Cost of sales ........................................................... 54.5 53.7 53.6
Grossprofit ........................................................... 45.5 46.3 46.4
Selling, general and administrative expense .................................. 26.5 26.5 26.5
Net licensing income .................................................... (0.3) (0.2) (0.2)
Income from operations .................................................. 19.3 20.0 20.1
Interest (income) expense, net ............................................. (0.3) (0.0) (0.0)
Incomebeforeincometax ................................................ 19.6 20.0 20.1
Incometaxexpense ..................................................... 6.9 7.4 7.5
Netincome............................................................ 12.7% 12.6% 12.6%
Year Ended December 31, 2004 Compared to Year Ended December 31, 2003
Net Sales: Consolidated net sales increased $143.5 million, or 15.1%, to $1,095.3 million in 2004 from
$951.8 million in 2003. Our sales growth was predominately driven by increased shipments of sportswear and
footwear which, when combined, represented over 80% of our total increase in sales. Increased sales of footwear
in the United States, Europe and Canada also contributed significantly to the increase in consolidated net sales.
Sales of outerwear continued to be a challenge in North America due to unseasonable winter weather and
increased competition; however, the increase in sales of outerwear internationally more than offset the declines in
the United States and Canada.
16