Columbia Sportswear 2004 Annual Report Download - page 20
Download and view the complete annual report
Please find page 20 of the 2004 Columbia Sportswear annual report below. You can navigate through the pages in the report by either clicking on the pages listed below, or by using the keyword search tool below to find specific information within the annual report.-
 1
1 -
2
-
3
-
4
-
5
-
6
-
7
-
8
-
9
-
 10
10 -
 11
11 -
 12
12 -
 13
13 -
 14
14 -
 15
15 -
 16
16 -
 17
17 -
 18
18 -
 19
19 -
 20
20 -
 21
21 -
 22
22 -
 23
23 -
 24
24 -
 25
25 -
 26
26 -
 27
27 -
 28
28 -
 29
29 -
 30
30 -
31
-
32
-
33
-
34
-
35
-
36
-
37
-
38
-
39
-
40
-
41
-
42
-
43
-
44
-
45
-
46
-
47
-
48
-
49
-
50
-
51
-
52
-
53
-
54
-
55
-
56
-
57
-
58
-
59
-
60
-
61
-
62
-
63
-
64
-
65
-
66
-
67
-
68
-
69
-
70
-
71
 |
 |
Item 7. MANAGEMENT’S DISCUSSION AND ANALYSIS OF FINANCIAL CONDITION AND
RESULTS OF OPERATIONS
This Annual Report contains forward-looking statements. Forward-looking statements include any
statements related to our expectations regarding future performance or conditions, including any statements
regarding anticipated sales growth across markets, distribution channels, and product categories, access to raw
materials and factory capacity, and financing and working capital requirements and resources.
These forward-looking statements, and others we make from time to time, are subject to a number of risks
and uncertainties. Many factors could cause actual results to differ materially from those projected in forward-
looking statements, including the risks described below under the heading “Factors That May Affect Our
Business and the Price of Our Common Stock.” We do not undertake any duty to update forward-looking
statements after the date they are made or to conform them to actual results or to changes in circumstances or
expectations.
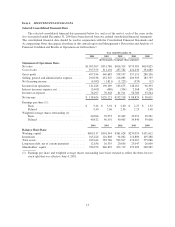
The following discussion of our results of operations and liquidity and capital resources, including known
trends and uncertainties identified by management, should be read in conjunction with the Consolidated
Financial Statements and Accompanying Notes that appear elsewhere in this annual report.
All references to years relate to the calendar year ended December 31 of the particular year.
Overview
Since our initial public offering in 1998, our net sales have steadily increased from $427.3 million in 1998
to $1,095.3 million in 2004, which equates to a compound annual growth rate of 17.0% for this period. Although
we cannot predict future results with certainty, our long-term goal is to capitalize on global market opportunities
for each of our key product categories. We are committed to our growth strategies of enhancing the retail
productivity of our customers, leveraging our brands in international markets, further developing our product
categories, selectively broadening our retail distribution channels and expanding the global awareness of our
brands through license agreements. With our well developed sourcing and distribution infrastructure and proven
design and product development team, we believe that we are well positioned for future long-term growth.
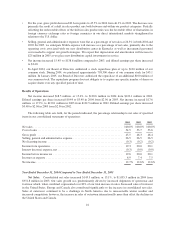
Highlights for the year ended December 31, 2004 are as follows:
• For the first time in Company history, annual sales exceeded $1 billion, increasing 15.1% to $1,095.3
million compared to 2003. Excluding changes in currency exchange rates, net sales increased 12.1%. As a
percentage of net sales, our sales growth is largely attributable to our international businesses, particularly
Europe and our international distributor based markets. However, in absolute dollar terms, nearly 50% of
our 2004 sales growth was the result of increased sales in the United States.
• From a product category perspective, sales of sportswear and footwear represented over 80% of sales
growth for the year. Although our sales product mix continues to shift due to increased sales of sportswear
and footwear, outerwear remains our largest product category representing $460.3 million or 42.0% of 2004
global net sales.
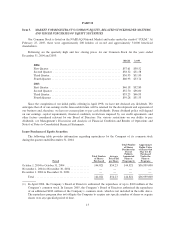
• Our backlog for the spring 2005 selling season as of September 30, 2004 increased $47.0 million, or 16.1%,
to $339.5 million from $292.5 million as of September 30, 2003. Excluding changes in currency exchange
rates, spring 2005 backlog increased 13.9%. Although we cannot predict with certainty any future results,
our reported backlog is one indicator of our anticipated growth rates for the spring 2005 selling season.
Many factors, however, could cause actual sales to differ materially from reported future order backlog.
Moreover, the reported increase in our spring 2005 backlog is not indicative of, and should not be utilized in
estimating growth for our fall 2005 selling season or any seasons beyond spring 2005. We will report our
backlog for the fall 2005 selling season as of March 31, 2005 with our first quarter earnings release in April
2005.
15