Columbia Sportswear 2004 Annual Report Download - page 24
Download and view the complete annual report
Please find page 24 of the 2004 Columbia Sportswear annual report below. You can navigate through the pages in the report by either clicking on the pages listed below, or by using the keyword search tool below to find specific information within the annual report.-
 1
1 -
2
-
3
-
4
-
5
-
6
-
7
-
8
-
9
-
10
-
11
-
12
-
13
-
 14
14 -
 15
15 -
 16
16 -
 17
17 -
 18
18 -
 19
19 -
 20
20 -
 21
21 -
 22
22 -
 23
23 -
 24
24 -
 25
25 -
 26
26 -
 27
27 -
 28
28 -
 29
29 -
 30
30 -
 31
31 -
 32
32 -
 33
33 -
 34
34 -
35
-
36
-
37
-
38
-
39
-
40
-
41
-
42
-
43
-
44
-
45
-
46
-
47
-
48
-
49
-
50
-
51
-
52
-
53
-
54
-
55
-
56
-
57
-
58
-
59
-
60
-
61
-
62
-
63
-
64
-
65
-
66
-
67
-
68
-
69
-
70
-
71
 |
 |
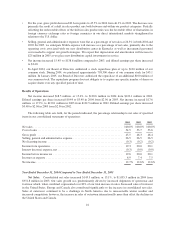
SG&A expense increased $38.2 million, or 15.1%, to $290.5 million in 2004 from $252.3 million in 2003.
As a percentage of net sales, SG&A expense was flat at 26.5% for each of 2004 and 2003.
Selling expenses decreased slightly as a percentage of net sales due to a decrease in relative advertising
expense. The decrease was primarily attributable to incremental advertising and promotional spending during
2003.
The increase in general and administrative expenses was primarily due to increased personnel, travel and
other operating expenses, including professional fees, which were partially offset by a decrease in depreciation
expense. The increase in personnel costs was partially attributable to increased headcount and contract labor to
support increased unit sales volume and our new distribution center in Kentucky. Increased headcount at our
corporate and subsidiary offices to support the higher levels of sales also resulted in increased personnel
spending. The increase in travel expense was a function of increased headcount as well as increased international
travel as our business matures outside the United States. Professional fees increased due to increased legal, audit
and consulting fees, many of which were associated with requirements of the Sarbanes-Oxley Act. Depreciation
and amortization totaled $18.6 million for 2004 compared to $23.1 million for 2003. The decrease was primarily
related to some assets in the United States becoming fully depreciated.
SG&A expense is expected to increase as percentage of net sales in 2005, compared to 2004, primarily due
to the operating costs associated with our new distribution center in Kentucky as well as incremental personnel
costs needed to support our growth strategies. We expect that depreciation and amortization will increase to
approximately $25 million in 2005 as we place new distribution capital investments in service.
Net Licensing Income: As our licensees have continued to gain momentum in the market place with the
sale of our branded products, our licensing arrangements have produced highly profitable income for the
company. We derive net licensing income from income that we earn through licensing our trademarks across a
range of categories that complement our current product offerings.
For 2004, we recognized licensing income from fourteen licensees. Products distributed by the licensees
included socks, bags, packs, leather, eyewear, watches, camping gear, home furnishings and other accessories.
Net licensing income increased $2.2 million, or 122.2%, to $4.0 million in 2004 from $1.8 million in 2003.
Licensing income in 2004 was led by Columbia licensed socks, followed by bags, eyewear, leather accessories
and camping gear.
Interest (Income) Expense, Net: Interest income was $4.1 million in 2004 compared to $2.1 million in
2003. The increase in interest income was due to the higher cash balance and higher interest rate environment
compared to the same period in 2003. Interest expense decreased to $0.6 million in 2004 from $1.6 million in
2003. The decrease in interest expense was attributable to an increase in capitalized interest of $0.8 million
primarily related to the construction of the distribution center in Kentucky and repayments of notes payable and
long-term debt.
Income Tax Expense: The provision for income taxes increased to $76.3 million in 2004 from $70.5
million in 2003. The reduction in the effective tax rate from 37.0% to 35.5% was due to several factors, including
changes in the geographic mix of taxable income as some of our international subsidiary growth rates exceeded
our United States growth rates coupled with reductions in our overall state income tax expense.
Year Ended December 31, 2003 Compared to Year Ended December 31, 2002
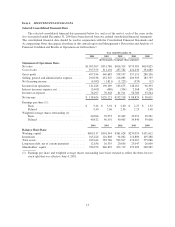
Net Sales: Consolidated net sales increased 16.6% to $951.8 million in 2003 from $816.3 million in 2002.
Our net sales growth was predominantly driven by the expansion of our international business, particularly our
European business, followed by our other international and Canadian businesses.
19