Columbia Sportswear 2004 Annual Report Download - page 25
Download and view the complete annual report
Please find page 25 of the 2004 Columbia Sportswear annual report below. You can navigate through the pages in the report by either clicking on the pages listed below, or by using the keyword search tool below to find specific information within the annual report.-
 1
1 -
2
-
3
-
4
-
5
-
6
-
7
-
8
-
9
-
10
-
11
-
12
-
13
-
14
-
 15
15 -
 16
16 -
 17
17 -
 18
18 -
 19
19 -
 20
20 -
 21
21 -
 22
22 -
 23
23 -
 24
24 -
 25
25 -
 26
26 -
 27
27 -
 28
28 -
 29
29 -
 30
30 -
 31
31 -
 32
32 -
 33
33 -
 34
34 -
 35
35 -
36
-
37
-
38
-
39
-
40
-
41
-
42
-
43
-
44
-
45
-
46
-
47
-
48
-
49
-
50
-
51
-
52
-
53
-
54
-
55
-
56
-
57
-
58
-
59
-
60
-
61
-
62
-
63
-
64
-
65
-
66
-
67
-
68
-
69
-
70
-
71
 |
 |
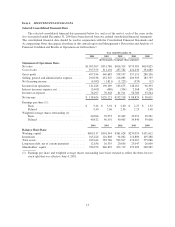
Sales growth was attributable to an increase in unit sales volume across all geographic markets and product
categories. Moreover, net sales growth was achieved in each of our product categories, in both dollars and unit
volumes, led by sportswear and followed by footwear, outerwear, accessories and equipment.
In 2003, we continued to experience a shift in our sales product mix as sales of sportswear and footwear
grew faster than outerwear and accessories. In 2002, outerwear represented 51.8% of net sales compared to
46.6% during 2003 while sportswear and footwear increased from 30.0% and 13.5% of net sales during 2002 to
32.7% and 15.6% of net sales during 2003, respectively. As a percentage of net sales, net sales from accessories
decreased slightly from 4.7% in 2002 to 4.6% in 2003. With our acquisition of Mountain Hardwear, we have a
new product category, equipment, which represented 0.5% of our 2003 net sales.
Net sales from outerwear increased $21.2 million, or 5.0%, to $443.7 million in 2003 from $422.5 million in
2002. Sales of outerwear decelerated in the United States due to the relative maturity of the outerwear product
category. Our outerwear business was more successful internationally where we experienced sales growth in
Europe, Canada and in our other international geographic locations. Net sales from sportswear increased $66.1
million, or 27.0%, to $311.3 million in 2003 from $245.2 million in 2002. Sportswear sales growth was achieved
in all global markets in 2003, led by strong gains in the United States followed by Europe and other international
markets. Net sales from footwear increased $38.6 million, or 35.1%, to $148.6 million in 2003 from $110.0
million in 2002. Footwear sales growth was achieved in each of our major markets, led by the United States and
followed by Europe, other international markets and Canada. Net sales from accessories increased $4.9 million,
or 12.7%, to $43.5 million in 2003 from $38.6 million in 2002. All major markets experienced strong accessory
shipments during 2003. Net sales from equipment, a new product category resulting from our acquisition of
Mountain Hardwear, represented $4.7 million of our total net sales during 2003. The equipment product category
consists primarily of tents and sleeping bags.
Net sales in the United States increased $39.3 million, or 7.0%, to $596.8 million in 2003 from $557.5
million in 2002. Net sales growth in the United States constituted 4.8% of the 16.6% increase in consolidated net
sales. Excluding Mountain Hardwear, domestic net sales increased 1.4%. The increase in domestic net sales was
the result of increased sales from sportswear and footwear partially offset by decreases in the outerwear category.
Europe’s net sales increased $39.3 million, or 41.0%, to $135.2 million in 2003 from $95.9 million in 2002.
Excluding changes in currency exchange rates, Europe’s net sales increased 18.5%. Europe’s net sales growth
constituted 4.8% of the 16.6% increase in consolidated net sales. Sales growth was achieved across all product
categories in Europe during 2003. Footwear led Europe’s sales growth followed by outerwear, sportswear and
accessories.
Canada’s net sales increased $20.0 million, or 23.1%, to $106.7 million in 2003 from $86.7 million in 2002.
Excluding changes in currency exchange rates, Canada’s net sales increased 9.6%. Canada’s net sales growth
constituted 2.5% of the 16.6% increase in consolidated net sales. Net sales growth was achieved across all
product categories led by footwear followed by sportswear, outerwear and accessories.
Net sales from other international geographies including Japan, Korea and our international distributors
increased $36.9 million, or 48.4%, to $113.1 million in 2003 from $76.2 million in 2002. Excluding changes in
currency exchange rates, other international sales increased 43.5%. Other international net sales growth
constituted 4.5% of the 16.6% increase in consolidated net sales. Net sales growth was achieved across all
product categories led by outerwear followed by sportswear, footwear and accessories.
Gross Profit: Gross profit as a percentage of net sales decreased slightly to 46.3% in 2003 from 46.4% in
2002.
A shift in product mix from our traditional outerwear products to sportswear and footwear had an
unfavorable impact on gross profit, but was offset by the effects of foreign currency fluctuations. In general, our
20