Columbia Sportswear 2004 Annual Report Download - page 19
Download and view the complete annual report
Please find page 19 of the 2004 Columbia Sportswear annual report below. You can navigate through the pages in the report by either clicking on the pages listed below, or by using the keyword search tool below to find specific information within the annual report.-
 1
1 -
2
-
3
-
4
-
5
-
6
-
7
-
8
-
 9
9 -
 10
10 -
 11
11 -
 12
12 -
 13
13 -
 14
14 -
 15
15 -
 16
16 -
 17
17 -
 18
18 -
 19
19 -
 20
20 -
 21
21 -
 22
22 -
 23
23 -
 24
24 -
 25
25 -
 26
26 -
 27
27 -
 28
28 -
 29
29 -
30
-
31
-
32
-
33
-
34
-
35
-
36
-
37
-
38
-
39
-
40
-
41
-
42
-
43
-
44
-
45
-
46
-
47
-
48
-
49
-
50
-
51
-
52
-
53
-
54
-
55
-
56
-
57
-
58
-
59
-
60
-
61
-
62
-
63
-
64
-
65
-
66
-
67
-
68
-
69
-
70
-
71
 |
 |

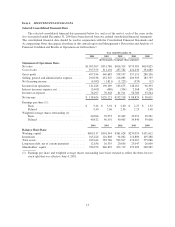
Item 6. SELECTED FINANCIAL DATA
Selected Consolidated Financial Data
The selected consolidated financial data presented below for, and as of the end of, each of the years in the
five-year period ended December 31, 2004 have been derived from our audited consolidated financial statements.
The consolidated financial data should be read in conjunction with the Consolidated Financial Statements and
Accompanying Notes that appear elsewhere in this annual report and Management’s Discussion and Analysis of
Financial Condition and Results of Operations set forth in Item 7.
Year ended December 31,
2004 2003 2002 2001 2000
(In thousands, except per share amounts)
Statement of Operations Data:
Net sales .................................. $1,095,307 $951,786 $816,319 $779,581 $614,825
Cost of sales ............................... 597,373 511,101 437,782 422,430 334,689
Grossprofit ................................ 497,934 440,685 378,537 357,151 280,136
Selling, general and administrative expense ....... 290,538 252,307 216,085 209,503 183,755
Net licensing income ......................... (4,032) (1,811) (1,223) (533) (12)
Income from operations ...................... 211,428 190,189 163,675 148,181 96,393
Interest (income) expense, net .................. (3,493) (480) (354) 2,568 4,238
Incometaxexpense .......................... 76,297 70,548 61,511 56,789 33,544
Netincome ................................ $ 138,624 $120,121 $102,518 $ 88,824 $ 58,611
Earnings per share (1):
Basic ................................. $ 3.44 $ 3.01 $ 2.60 $ 2.27 $ 1.52
Diluted................................ 3.40 2.96 2.56 2.23 1.48
Weighted average shares outstanding (1):
Basic ................................. 40,266 39,953 39,449 39,051 38,541
Diluted................................ 40,812 40,591 40,063 39,840 39,608
2004 2003 2002 2001 2000
Balance Sheet Data:
Working capital .............................. $609,137 $501,344 $361,628 $270,959 $191,612
Inventories .................................. 165,426 126,808 94,862 114,889 105,288
Total assets .................................. 949,444 783,766 592,817 474,967 375,086
Long-term debt, net of current maturities .......... 12,636 16,335 20,636 25,047 26,000
Shareholders’ equity ........................... 780,250 640,829 472,719 353,389 248,989
(1) Earnings per share and weighted average shares outstanding have been restated to reflect the three-for-two
stock split that was effective June 4, 2001.
14