Classmates.com 2010 Annual Report Download - page 81
Download and view the complete annual report
Please find page 81 of the 2010 Classmates.com annual report below. You can navigate through the pages in the report by either clicking on the pages listed below, or by using the keyword search tool below to find specific information within the annual report.-
 1
1 -
2
-
3
-
4
-
5
-
6
-
7
-
8
-
9
-
10
-
11
-
12
-
13
-
14
-
15
-
16
-
17
-
18
-
19
-
20
-
21
-
22
-
23
-
24
-
25
-
26
-
27
-
28
-
29
-
30
-
31
-
32
-
33
-
34
-
35
-
36
-
37
-
38
-
39
-
40
-
41
-
42
-
43
-
44
-
45
-
46
-
47
-
48
-
49
-
50
-
51
-
52
-
53
-
54
-
55
-
56
-
57
-
58
-
59
-
60
-
61
-
62
-
63
-
64
-
65
-
66
-
67
-
68
-
69
-
70
-
 71
71 -
 72
72 -
 73
73 -
 74
74 -
 75
75 -
 76
76 -
 77
77 -
 78
78 -
 79
79 -
 80
80 -
 81
81 -
 82
82 -
 83
83 -
 84
84 -
 85
85 -
 86
86 -
 87
87 -
 88
88 -
 89
89 -
 90
90 -
 91
91 -
92
-
93
-
94
-
95
-
96
-
97
-
98
-
99
-
100
-
101
-
102
-
103
-
104
-
105
-
106
-
107
-
108
-
109
-
110
-
111
-
112
-
113
-
114
-
115
-
116
-
117
-
118
-
119
-
120
-
121
-
122
-
123
-
124
-
125
-
126
-
127
-
128
-
129
-
130
-
131
-
132
-
133
-
134
-
135
-
136
-
137
-
138
-
139
-
140
-
141
-
142
-
143
-
144
-
145
-
146
-
147
-
148
-
149
-
150
-
151
-
152
-
153
-
154
-
155
-
156
-
157
-
158
-
159
-
160
-
161
-
162
-
163
-
164
-
165
-
166
-
167
-
168
-
169
-
170
-
171
-
172
-
173
-
174
-
175
-
176
-
177
-
178
-
179
-
180
-
181
-
182
-
183
-
184
-
185
-
186
-
187
-
188
-
189
-
190
-
191
-
192
-
193
-
194
-
195
-
196
-
197
-
198
-
199
-
200
-
201
-
202
-
203
-
204
-
205
-
206
-
207
-
208
-
209
-
210
-
211
-
212
-
213
-
214
-
215
-
216
-
217
-
218
-
219
-
220
-
221
-
222
-
223
-
224
-
225
-
226
-
227
-
228
-
229
-
230
-
231
-
232
-
233
-
234
-
235
-
236
-
237
-
238
-
239
-
240
-
241
-
242
-
243
-
244
-
245
-
246
-
247
-
248
-
249
-
250
-
251
-
252
-
253
-
254
-
255
-
256
-
257
-
258
-
259
-
260
-
261
-
262
-
263
-
264
-
265
-
266
-
267
-
268
-
269
-
270
-
271
-
272
-
273
-
274
-
275
-
276
-
277
-
278
-
279
-
280
-
281
-
282
-
283
-
284
-
285
-
286
-
287
-
288
-
289
-
290
-
291
-
292
-
293
-
294
-
295
-
296
-
297
-
298
-
299
-
300
-
301
-
302
-
303
-
304
-
305
-
306
-
307
-
308
-
309
-
310
-
311
-
312
-
313
-
314
-
315
-
316
-
317
-
318
-
319
-
320
-
321
-
322
-
323
-
324
-
325
-
326
-
327
-
328
-
329
-
330
-
331
-
332
-
333
 |
 |

Table of Contents
activities is driven by our net income adjusted for non-cash items, including, but not limited to, depreciation and amortization, stock-based
compensation, impairment of goodwill, intangible assets and long-lived assets, deferred taxes, tax benefits from equity awards and changes in
operating assets and liabilities. The year ended December 31, 2009 includes the results of FTD, which we acquired in August 2008. Net income,
adjusted for non-cash items, increased by $26.2 million, or 19%, to $170.5 million. This increase was offset by a $26.7 million decrease in
working capital, primarily related to a decrease in deferred revenue in 2009, compared to the prior-year period, resulting from an increase in the
number of pay accounts with discounted promotional pricing plans in our Content & Media segment as well as a reduction in the number of pay
accounts with longer-term plans in our Communications segment.
Net cash used for investing activities decreased by $232.4 million, or 89.9%, for the year ended December 31, 2009, compared to the year
ended December 31, 2008. The decrease was primarily due to $307.5 million in cash paid for our FTD acquisition in August 2008. The decrease
was partially offset by a $68.8 million decrease in net proceeds from sales and maturities of short-term investments for the year ended
December 31, 2009, compared to the prior-year period, as a result of our decision to liquidate our short-term investments portfolio in 2008 and a
$6.3 million increase in capital expenditures for the year ended December 31, 2009 compared to the year ended December 31, 2008.
Net cash used for financing activities increased by $179.8 million, or 347.0%, for the year ended December 31, 2009, compared to the year
ended December 31, 2008. The increase in net cash used for financing activities was primarily due to $422.0 million in net proceeds from the
UOL Credit Agreement and the FTD Credit Agreement received for the year ended December 31, 2008, partially offset by a decrease in
payments on term loans of $223.6 million for the year ended December 31, 2009, compared to the year ended December 31, 2008. The increase
in net cash used for financing activities was also partially offset by a $16.8 million decrease in the payment of dividends and dividend
equivalents resulting from the decrease in our quarterly cash dividend from $0.20 per share of common stock to $0.10 per share of common
stock subsequent to the FTD acquisition and a decrease in repurchases of common stock of $2.0 million related to cash paid for employee tax
withholding upon vesting of restricted stock units and restricted stock awards and upon the issuance of stock awards.
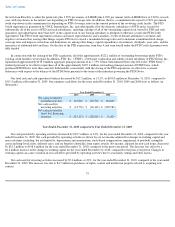
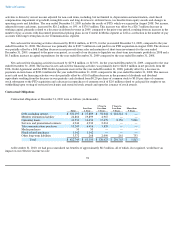
Contractual Obligations
Contractual obligations at December 31, 2010 were as follows (in thousands):
At December 31, 2010, we had gross unrealized tax benefits of approximately $8.5 million, all of which, if recognized, would have an
impact on our effective income tax rate.
78
Total
Less than
1 Year
1 Year to
Less than
3 Years
3 Years to
Less than
5 Years
More than
5 Years
Debt, including interest
$
332,197
$
17,809
$
92,044
$
222,344
$
—
Member redemption liability
24,866
19,899
4,967
—
—
Operating leases
41,533
12,636
15,679
8,158
5,060
Services and promotional contracts
6,944
4,930
2,014
—
—
Telecommunications purchases
10,245
6,416
3,829
—
—
Media purchases
50
50
—
—
—
Floral
-
related purchases
3,542
3,542
—
—
—
Other long
-
term liabilities
3,372
268
2,090
261
753
Total
$
422,749
$
65,550
$
120,623
$
230,763
$
5,813