Classmates.com 2010 Annual Report Download - page 65
Download and view the complete annual report
Please find page 65 of the 2010 Classmates.com annual report below. You can navigate through the pages in the report by either clicking on the pages listed below, or by using the keyword search tool below to find specific information within the annual report.-
 1
1 -
2
-
3
-
4
-
5
-
6
-
7
-
8
-
9
-
10
-
11
-
12
-
13
-
14
-
15
-
16
-
17
-
18
-
19
-
20
-
21
-
22
-
23
-
24
-
25
-
26
-
27
-
28
-
29
-
30
-
31
-
32
-
33
-
34
-
35
-
36
-
37
-
38
-
39
-
40
-
41
-
42
-
43
-
44
-
45
-
46
-
47
-
48
-
49
-
50
-
51
-
52
-
53
-
54
-
 55
55 -
 56
56 -
 57
57 -
 58
58 -
 59
59 -
 60
60 -
 61
61 -
 62
62 -
 63
63 -
 64
64 -
 65
65 -
 66
66 -
 67
67 -
 68
68 -
 69
69 -
 70
70 -
 71
71 -
 72
72 -
 73
73 -
 74
74 -
 75
75 -
76
-
77
-
78
-
79
-
80
-
81
-
82
-
83
-
84
-
85
-
86
-
87
-
88
-
89
-
90
-
91
-
92
-
93
-
94
-
95
-
96
-
97
-
98
-
99
-
100
-
101
-
102
-
103
-
104
-
105
-
106
-
107
-
108
-
109
-
110
-
111
-
112
-
113
-
114
-
115
-
116
-
117
-
118
-
119
-
120
-
121
-
122
-
123
-
124
-
125
-
126
-
127
-
128
-
129
-
130
-
131
-
132
-
133
-
134
-
135
-
136
-
137
-
138
-
139
-
140
-
141
-
142
-
143
-
144
-
145
-
146
-
147
-
148
-
149
-
150
-
151
-
152
-
153
-
154
-
155
-
156
-
157
-
158
-
159
-
160
-
161
-
162
-
163
-
164
-
165
-
166
-
167
-
168
-
169
-
170
-
171
-
172
-
173
-
174
-
175
-
176
-
177
-
178
-
179
-
180
-
181
-
182
-
183
-
184
-
185
-
186
-
187
-
188
-
189
-
190
-
191
-
192
-
193
-
194
-
195
-
196
-
197
-
198
-
199
-
200
-
201
-
202
-
203
-
204
-
205
-
206
-
207
-
208
-
209
-
210
-
211
-
212
-
213
-
214
-
215
-
216
-
217
-
218
-
219
-
220
-
221
-
222
-
223
-
224
-
225
-
226
-
227
-
228
-
229
-
230
-
231
-
232
-
233
-
234
-
235
-
236
-
237
-
238
-
239
-
240
-
241
-
242
-
243
-
244
-
245
-
246
-
247
-
248
-
249
-
250
-
251
-
252
-
253
-
254
-
255
-
256
-
257
-
258
-
259
-
260
-
261
-
262
-
263
-
264
-
265
-
266
-
267
-
268
-
269
-
270
-
271
-
272
-
273
-
274
-
275
-
276
-
277
-
278
-
279
-
280
-
281
-
282
-
283
-
284
-
285
-
286
-
287
-
288
-
289
-
290
-
291
-
292
-
293
-
294
-
295
-
296
-
297
-
298
-
299
-
300
-
301
-
302
-
303
-
304
-
305
-
306
-
307
-
308
-
309
-
310
-
311
-
312
-
313
-
314
-
315
-
316
-
317
-
318
-
319
-
320
-
321
-
322
-
323
-
324
-
325
-
326
-
327
-
328
-
329
-
330
-
331
-
332
-
333
 |
 |

Table of Contents
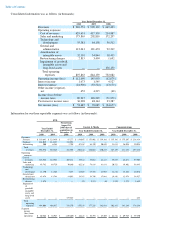
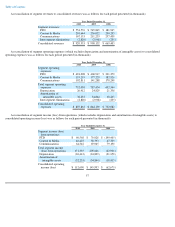
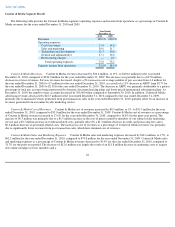
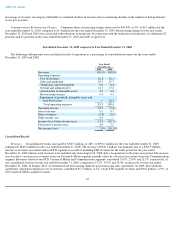
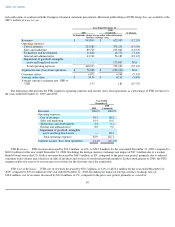
Content & Media Segment Results
The following table presents the Content & Media segment's operating expenses and income from operations as a percentage of Content &
Media revenues for the years ended December 31, 2010 and 2009.
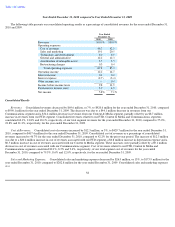
Content & Media Revenues. Content & Media revenues decreased by $34.4 million, or 15%, to $201.6 million for the year ended
December 31, 2010, compared to $236.0 million for the year ended December 31, 2009. The decrease was partially due to a $17.8 million
decrease in services revenues. Services revenues decreased, despite a 2% increase in our average number of pay accounts from 4.6 million for
the year ended December 31, 2009 to 4.7 million for the year ended December 31, 2010, as a result of a 13% decrease in ARPU from $2.75 for
the year ended December 31, 2009 to $2.38 for the year ended December 31, 2010. The decrease in ARPU was primarily attributable to a greater
percentage of total pay accounts being represented by domestic discounted pricing plans and lower-priced international subscription plans. At
December 31, 2010, the number of pay accounts decreased by 296,000 when compared to September 30, 2010. In addition, Content & Media
advertising revenues decreased by $16.5 million for the year ended December 31, 2010 compared to the year ended December 31, 2009,
primarily due to minimal revenues generated from post-transaction sales in the year ended December 31, 2010, partially offset by an increase in
revenues generated from our online loyalty marketing service.
Content & Media Cost of Revenues. Content & Media cost of revenues increased by $0.5 million, or 1%, to $35.5 million for the year
ended December 31, 2010, compared to $35.0 million for the year ended December 31, 2009. Content & Media cost of revenues as a percentage
of Content & Media revenues increased to 17.6% for the year ended December 31, 2010, compared to 14.8% for the prior-year period. The
increase of $0.5 million was primarily due to a $1.5 million increase in the cost of points earned by members of our online loyalty marketing
service and a $0.7 million increase in overhead-related costs, partially offset by a $1.3 million decrease in credit card processing fees and a
$0.4 million decrease in personnel-related costs. The increase in cost of revenues as a percentage of Content & Media revenues was primarily
due to significantly lower revenues from post-transaction sales, which have minimal cost of revenues.
Content & Media Sales and Marketing Expenses. Content & Media sales and marketing expenses decreased by $12.6 million, or 17%, to
$62.2 million for the year ended December 31, 2010, compared to $74.8 million for the year ended December 31, 2009. Content & Media sales
and marketing expenses as a percentage of Content & Media revenues decreased to 30.9% for the year ended December 31, 2010, compared to
31.7% for the prior-year period. The decrease of $12.6 million was largely the result of an $11.8 million decrease in marketing costs to acquire
new online nostalgia services members and a
62
Year Ended
December 31,
2010
2009
Revenues
100.0
%
100.0
%
Operating expenses:
Cost of revenues
17.6
14.8
Sales and marketing
30.9
31.7
Technology and development
11.3
10.8
General and administrative
17.2
16.8
Restructuring charges
—
0.9
Total operating expenses
77.0
75.1
Segment income from operations
23.0
%
24.9
%