Classmates.com 2010 Annual Report Download - page 67
Download and view the complete annual report
Please find page 67 of the 2010 Classmates.com annual report below. You can navigate through the pages in the report by either clicking on the pages listed below, or by using the keyword search tool below to find specific information within the annual report.-
 1
1 -
2
-
3
-
4
-
5
-
6
-
7
-
8
-
9
-
10
-
11
-
12
-
13
-
14
-
15
-
16
-
17
-
18
-
19
-
20
-
21
-
22
-
23
-
24
-
25
-
26
-
27
-
28
-
29
-
30
-
31
-
32
-
33
-
34
-
35
-
36
-
37
-
38
-
39
-
40
-
41
-
42
-
43
-
44
-
45
-
46
-
47
-
48
-
49
-
50
-
51
-
52
-
53
-
54
-
55
-
56
-
 57
57 -
 58
58 -
 59
59 -
 60
60 -
 61
61 -
 62
62 -
 63
63 -
 64
64 -
 65
65 -
 66
66 -
 67
67 -
 68
68 -
 69
69 -
 70
70 -
 71
71 -
 72
72 -
 73
73 -
 74
74 -
 75
75 -
 76
76 -
 77
77 -
78
-
79
-
80
-
81
-
82
-
83
-
84
-
85
-
86
-
87
-
88
-
89
-
90
-
91
-
92
-
93
-
94
-
95
-
96
-
97
-
98
-
99
-
100
-
101
-
102
-
103
-
104
-
105
-
106
-
107
-
108
-
109
-
110
-
111
-
112
-
113
-
114
-
115
-
116
-
117
-
118
-
119
-
120
-
121
-
122
-
123
-
124
-
125
-
126
-
127
-
128
-
129
-
130
-
131
-
132
-
133
-
134
-
135
-
136
-
137
-
138
-
139
-
140
-
141
-
142
-
143
-
144
-
145
-
146
-
147
-
148
-
149
-
150
-
151
-
152
-
153
-
154
-
155
-
156
-
157
-
158
-
159
-
160
-
161
-
162
-
163
-
164
-
165
-
166
-
167
-
168
-
169
-
170
-
171
-
172
-
173
-
174
-
175
-
176
-
177
-
178
-
179
-
180
-
181
-
182
-
183
-
184
-
185
-
186
-
187
-
188
-
189
-
190
-
191
-
192
-
193
-
194
-
195
-
196
-
197
-
198
-
199
-
200
-
201
-
202
-
203
-
204
-
205
-
206
-
207
-
208
-
209
-
210
-
211
-
212
-
213
-
214
-
215
-
216
-
217
-
218
-
219
-
220
-
221
-
222
-
223
-
224
-
225
-
226
-
227
-
228
-
229
-
230
-
231
-
232
-
233
-
234
-
235
-
236
-
237
-
238
-
239
-
240
-
241
-
242
-
243
-
244
-
245
-
246
-
247
-
248
-
249
-
250
-
251
-
252
-
253
-
254
-
255
-
256
-
257
-
258
-
259
-
260
-
261
-
262
-
263
-
264
-
265
-
266
-
267
-
268
-
269
-
270
-
271
-
272
-
273
-
274
-
275
-
276
-
277
-
278
-
279
-
280
-
281
-
282
-
283
-
284
-
285
-
286
-
287
-
288
-
289
-
290
-
291
-
292
-
293
-
294
-
295
-
296
-
297
-
298
-
299
-
300
-
301
-
302
-
303
-
304
-
305
-
306
-
307
-
308
-
309
-
310
-
311
-
312
-
313
-
314
-
315
-
316
-
317
-
318
-
319
-
320
-
321
-
322
-
323
-
324
-
325
-
326
-
327
-
328
-
329
-
330
-
331
-
332
-
333
 |
 |

Table of Contents
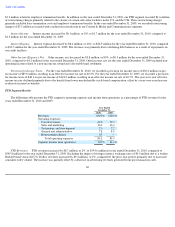
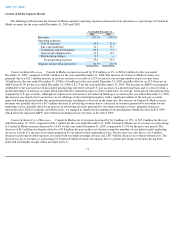
1.2 million for the year ended December 31, 2009 to 0.9 million for the year ended December 31, 2010, partially offset by an increase in ARPU
from $9.47 for the year ended December 31, 2009 to $9.49 for the year ended December 31, 2010. The decrease in Communications revenues
was also due to a $4.2 million decrease in advertising revenues resulting from the decrease in pay accounts and a decrease in search revenues
following our transition to a new search provider in the first quarter of 2010. We expect that Communications pay accounts and services
revenues will continue to decline.
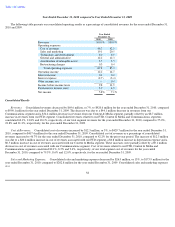
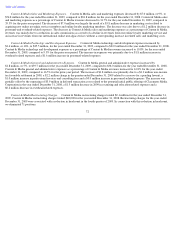
Communications Cost of Revenues. Communications cost of revenues decreased by $9.1 million, or 19%, to $39.6 million for the year
ended December 31, 2010, compared to $48.7 million for the year ended December 31, 2009. Communications cost of revenues as a percentage
of Communications revenues increased to 23.7% for the year ended December 31, 2010, compared to 23.0% for the prior-year period due to a
higher percentage of revenues being generated from our broadband services which have a higher cost of revenues than our dial-up Internet
access services. The decrease of $9.1 million was primarily due to a $3.9 million decrease in telecommunications costs associated with our dial-
up Internet access services due to a decrease in the number of dial-up Internet access pay accounts and a decrease in hourly usage per pay
account and a $3.1 million decrease in customer support and billing-related costs due to a decrease in the number of dial-up Internet access pay
accounts. In addition, Communications cost of revenues decreased due to a $0.9 million decrease in personnel-
related costs as a result of reduced
headcount, a $0.9 million decrease in costs associated with our broadband services and a $0.3 million decrease in costs associated with our web
hosting services. We expect cost of revenues as a percentage of revenues to continue to increase as revenues continue to decrease without a
corresponding decrease in cost of revenues as a result of a higher percentage of fixed costs as compared to variable costs.
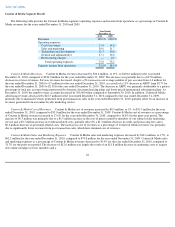
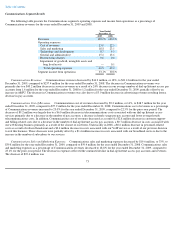
Communications Sales and Marketing Expenses. Communications sales and marketing expenses decreased by $19.3 million, or 48%, to
$20.5 million for the year ended December 31, 2010, compared to $39.8 million for the year ended December 31, 2009. Communications sales
and marketing expenses as a percentage of Communications revenues decreased to 12.3% for the year ended December 31, 2010, compared to
18.8% for the prior-year period. The decrease in expenses reflects the Company's decision to reduce sales and marketing expenses. The decrease
of $19.3 million was primarily attributable to a $15.1 million decline in advertising, promotion and distribution costs related to our dial-up
Internet access services, a $2.1 million decrease in customer service costs related to our dial-up Internet access services, and a $1.8 million
decrease in personnel- and overhead-related expenses as a result of reduced headcount.
Communications Technology and Development Expenses. Communications technology and development expenses decreased by
$6.2 million, or 34%, to $12.3 million for the year ended December 31, 2010, compared to $18.5 million for the year ended December 31, 2009.
Communications technology and development expenses as a percentage of Communications revenues decreased to 7.3% for the year ended
December 31, 2010, compared to 8.7% for the prior-year period. The decrease of $6.2 million was the result of a decrease in personnel- and
overhead-related expenses as a result of reduced headcount.
Communications General and Administrative Expenses.
Communications general and administrative expenses decreased by $3.9 million,
or 12%, to $29.1 million for the year ended December 31, 2010, compared to $33.0 million for the year ended December 31, 2009.
Communications general and administrative expenses as a percentage of Communications revenues increased to 17.4% for the year ended
December 31, 2010, compared to 15.6% for the prior-year period. The decrease of $3.9 million was due to a $3.5 million decrease in personnel-
and overhead-related costs as a result of reduced headcount, a $0.8 million decrease in professional services and consulting fees and a
$0.4 million decrease in bad debt expense. The decrease was partially offset by $0.7 million of expenses related to a potential transaction in the
first quarter of 2010 that failed to consummate. The increase as a
64