Classmates.com 2010 Annual Report Download - page 63
Download and view the complete annual report
Please find page 63 of the 2010 Classmates.com annual report below. You can navigate through the pages in the report by either clicking on the pages listed below, or by using the keyword search tool below to find specific information within the annual report.-
 1
1 -
2
-
3
-
4
-
5
-
6
-
7
-
8
-
9
-
10
-
11
-
12
-
13
-
14
-
15
-
16
-
17
-
18
-
19
-
20
-
21
-
22
-
23
-
24
-
25
-
26
-
27
-
28
-
29
-
30
-
31
-
32
-
33
-
34
-
35
-
36
-
37
-
38
-
39
-
40
-
41
-
42
-
43
-
44
-
45
-
46
-
47
-
48
-
49
-
50
-
51
-
52
-
 53
53 -
 54
54 -
 55
55 -
 56
56 -
 57
57 -
 58
58 -
 59
59 -
 60
60 -
 61
61 -
 62
62 -
 63
63 -
 64
64 -
 65
65 -
 66
66 -
 67
67 -
 68
68 -
 69
69 -
 70
70 -
 71
71 -
 72
72 -
 73
73 -
74
-
75
-
76
-
77
-
78
-
79
-
80
-
81
-
82
-
83
-
84
-
85
-
86
-
87
-
88
-
89
-
90
-
91
-
92
-
93
-
94
-
95
-
96
-
97
-
98
-
99
-
100
-
101
-
102
-
103
-
104
-
105
-
106
-
107
-
108
-
109
-
110
-
111
-
112
-
113
-
114
-
115
-
116
-
117
-
118
-
119
-
120
-
121
-
122
-
123
-
124
-
125
-
126
-
127
-
128
-
129
-
130
-
131
-
132
-
133
-
134
-
135
-
136
-
137
-
138
-
139
-
140
-
141
-
142
-
143
-
144
-
145
-
146
-
147
-
148
-
149
-
150
-
151
-
152
-
153
-
154
-
155
-
156
-
157
-
158
-
159
-
160
-
161
-
162
-
163
-
164
-
165
-
166
-
167
-
168
-
169
-
170
-
171
-
172
-
173
-
174
-
175
-
176
-
177
-
178
-
179
-
180
-
181
-
182
-
183
-
184
-
185
-
186
-
187
-
188
-
189
-
190
-
191
-
192
-
193
-
194
-
195
-
196
-
197
-
198
-
199
-
200
-
201
-
202
-
203
-
204
-
205
-
206
-
207
-
208
-
209
-
210
-
211
-
212
-
213
-
214
-
215
-
216
-
217
-
218
-
219
-
220
-
221
-
222
-
223
-
224
-
225
-
226
-
227
-
228
-
229
-
230
-
231
-
232
-
233
-
234
-
235
-
236
-
237
-
238
-
239
-
240
-
241
-
242
-
243
-
244
-
245
-
246
-
247
-
248
-
249
-
250
-
251
-
252
-
253
-
254
-
255
-
256
-
257
-
258
-
259
-
260
-
261
-
262
-
263
-
264
-
265
-
266
-
267
-
268
-
269
-
270
-
271
-
272
-
273
-
274
-
275
-
276
-
277
-
278
-
279
-
280
-
281
-
282
-
283
-
284
-
285
-
286
-
287
-
288
-
289
-
290
-
291
-
292
-
293
-
294
-
295
-
296
-
297
-
298
-
299
-
300
-
301
-
302
-
303
-
304
-
305
-
306
-
307
-
308
-
309
-
310
-
311
-
312
-
313
-
314
-
315
-
316
-
317
-
318
-
319
-
320
-
321
-
322
-
323
-
324
-
325
-
326
-
327
-
328
-
329
-
330
-
331
-
332
-
333
 |
 |

Table of Contents
$1.3 million related to employee termination benefits. In addition, in the year ended December 31, 2010, our FTD segment recorded $1.6 million
of restructuring charges primarily related to the closure of certain call center facilities in the U.S. and the U.K. These restructuring charges
primarily included lease termination costs and employee termination benefits. In the year ended December 31, 2009, we recorded restructuring
charges of $3.5 million associated with a reduction in headcount in our Content & Media and Communications segments.
Interest Income. Interest income increased by $0.1 million, or 8%, to $1.7 million for the year ended December 31, 2010, compared to
$1.5 million for the year ended December 31, 2009.
Interest Expense. Interest expense decreased by $8.6 million, or 26%, to $24.9 million for the year ended December 31, 2010, compared
to $33.5 million for the year ended December 31, 2009. The decrease was primarily due to declining debt balances as a result of repayments on
our credit facilities.
Other Income (Expense), Net. Other income, net, decreased by $3.8 million, or 89%, to $0.5 million for the year ended December 31,
2010, compared to $4.2 million for the year ended December 31, 2009. Other income, net, for the year ended December 31, 2009 included non-
operating income related to a non-income tax refund and a favorable legal settlement.
Provision for Income Taxes. For the year ended December 31, 2010, we recorded a provision for income taxes of $36.2 million on pre-
tax income of $89.9 million, resulting in an effective income tax rate of 40.3%. For the year ended December 31, 2009, we recorded a provision
for income taxes of $48.1 on pre-tax income of $118.2 million, resulting in an effective income tax rate of 40.7%. The year-over-year effective
income tax rate declined primarily due to the benefit from lower non-deductible stock-based compensation, offset by a year-over-year decrease
in discrete income tax benefits.
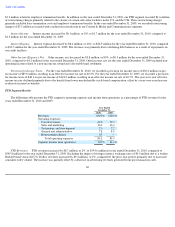
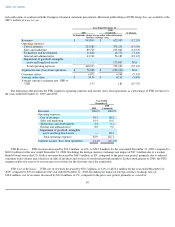
FTD Segment Results
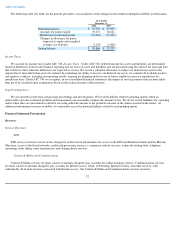
The following table presents the FTD segment's operating expenses and income from operations as a percentage of FTD revenues for the
years ended December 31, 2010 and 2009.
FTD Revenues. FTD revenues increased by $8.7 million, or 2%, to $554.6 million for year ended December 31, 2010, compared to
$545.8 million for the year ended December 31, 2009. Excluding the impact of foreign currency exchange rates of $0.6 million due to a weaker
British Pound versus the U.S. Dollar, revenues increased by $9.4 million, or 2%, compared to the prior-year period, primarily due to increased
consumer order volume. The increase was partially offset by a decrease in advertising revenues generated from post-transaction sales.
60
Year Ended
December 31,
2010
2009
Revenues
100.0
%
100.0
%
Operating expenses:
Cost of revenues
62.0
59.3
Sales and marketing
16.9
16.4
Technology and development
2.0
2.2
General and administrative
7.8
8.0
Restructuring charges
0.3
—
Total operating expenses
89.1
85.9
Segment income from operations
10.9
%
14.1
%