Classmates.com 2010 Annual Report Download - page 112
Download and view the complete annual report
Please find page 112 of the 2010 Classmates.com annual report below. You can navigate through the pages in the report by either clicking on the pages listed below, or by using the keyword search tool below to find specific information within the annual report.-
 1
1 -
2
-
3
-
4
-
5
-
6
-
7
-
8
-
9
-
10
-
11
-
12
-
13
-
14
-
15
-
16
-
17
-
18
-
19
-
20
-
21
-
22
-
23
-
24
-
25
-
26
-
27
-
28
-
29
-
30
-
31
-
32
-
33
-
34
-
35
-
36
-
37
-
38
-
39
-
40
-
41
-
42
-
43
-
44
-
45
-
46
-
47
-
48
-
49
-
50
-
51
-
52
-
53
-
54
-
55
-
56
-
57
-
58
-
59
-
60
-
61
-
62
-
63
-
64
-
65
-
66
-
67
-
68
-
69
-
70
-
71
-
72
-
73
-
74
-
75
-
76
-
77
-
78
-
79
-
80
-
81
-
82
-
83
-
84
-
85
-
86
-
87
-
88
-
89
-
90
-
91
-
92
-
93
-
94
-
95
-
96
-
97
-
98
-
99
-
100
-
101
-
 102
102 -
 103
103 -
 104
104 -
 105
105 -
 106
106 -
 107
107 -
 108
108 -
 109
109 -
 110
110 -
 111
111 -
 112
112 -
 113
113 -
 114
114 -
 115
115 -
 116
116 -
 117
117 -
 118
118 -
 119
119 -
 120
120 -
 121
121 -
 122
122 -
123
-
124
-
125
-
126
-
127
-
128
-
129
-
130
-
131
-
132
-
133
-
134
-
135
-
136
-
137
-
138
-
139
-
140
-
141
-
142
-
143
-
144
-
145
-
146
-
147
-
148
-
149
-
150
-
151
-
152
-
153
-
154
-
155
-
156
-
157
-
158
-
159
-
160
-
161
-
162
-
163
-
164
-
165
-
166
-
167
-
168
-
169
-
170
-
171
-
172
-
173
-
174
-
175
-
176
-
177
-
178
-
179
-
180
-
181
-
182
-
183
-
184
-
185
-
186
-
187
-
188
-
189
-
190
-
191
-
192
-
193
-
194
-
195
-
196
-
197
-
198
-
199
-
200
-
201
-
202
-
203
-
204
-
205
-
206
-
207
-
208
-
209
-
210
-
211
-
212
-
213
-
214
-
215
-
216
-
217
-
218
-
219
-
220
-
221
-
222
-
223
-
224
-
225
-
226
-
227
-
228
-
229
-
230
-
231
-
232
-
233
-
234
-
235
-
236
-
237
-
238
-
239
-
240
-
241
-
242
-
243
-
244
-
245
-
246
-
247
-
248
-
249
-
250
-
251
-
252
-
253
-
254
-
255
-
256
-
257
-
258
-
259
-
260
-
261
-
262
-
263
-
264
-
265
-
266
-
267
-
268
-
269
-
270
-
271
-
272
-
273
-
274
-
275
-
276
-
277
-
278
-
279
-
280
-
281
-
282
-
283
-
284
-
285
-
286
-
287
-
288
-
289
-
290
-
291
-
292
-
293
-
294
-
295
-
296
-
297
-
298
-
299
-
300
-
301
-
302
-
303
-
304
-
305
-
306
-
307
-
308
-
309
-
310
-
311
-
312
-
313
-
314
-
315
-
316
-
317
-
318
-
319
-
320
-
321
-
322
-
323
-
324
-
325
-
326
-
327
-
328
-
329
-
330
-
331
-
332
-
333
 |
 |

Table of Contents
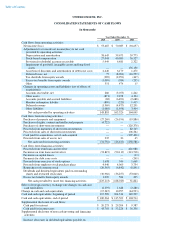
UNITED ONLINE, INC.
CONSOLIDATED STATEMENTS OF CASH FLOWS
(in thousands)
Year Ended December 31,
2010 2009 2008
Cash flows from operating activities:
Net income (loss)
$
53,687
$
70,085
$
(94,657
)
Adjustments to reconcile net income(loss) to net cash
provided by operating activities:
Depreciation and amortization
58,645
59,673
39,773
Stock
-
based compensation
27,043
40,080
36,527
Provision for doubtful accounts receivable
5,449
6,481
2,322
Impairment of goodwill, intangible assets and long-lived
assets
—
—
176,150
Accretion of discounts and amortization of debt issue costs
4,446
6,179
1,470
Deferred taxes, net
77
(8,902
)
(16,557
)
Tax shortfalls from equity awards
(390
)
(2,996
)
(467
)
Excess tax benefits from equity awards
(1,099
)
(584
)
(295
)
Other
551
474
15
Changes in operating assets and liabilities (net of effects of
acquisitions):
Accounts receivable, net
286
(3,073
)
1,242
Other assets
(871
)
9,258
4,194
Accounts payable and accrued liabilities
(82
)
(6,496
)
(2,688
)
Member redemption liability
(890
)
(220
)
1,415
Deferred revenue
(1,969
)
(4,475
)
12,201
Other liabilities
(1,080
)
(1,958
)
3,404
Net cash provided by operating activities
143,803
163,526
164,049
Cash flows from investing activities:
Purchases of property and equipment
(27,269
)
(26,196
)
(19,886
)
Purchases of rights, content and intellectual property
(4,722
)
—
—
Purchases of short
-
term investments
—
—
(
120,378
)
Proceeds from maturities of short
-
term investments
—
—
82,765
Proceeds from sales of short
-
term investments
—
—
106,364
Cash paid for acquisitions, net of cash acquired
—
—
(
307,496
)
Proceeds from sales of assets, net
235
36
45
Net cash used for investing activities
(31,756
)
(26,160
)
(258,586
)
Cash flows from financing activities:
Proceeds from term loans and revolver
—
—
421,988
Payments on term loans and revolver
(74,819
)
(90,119
)
(313,718
)
Payments on capital leases
—
—
(
13
)
Payments for debt issue costs
—
—
(
249
)
Proceeds from exercises of stock options
1,698
546
1,668
Proceeds from employee stock purchase plans
4,440
4,069
3,754
Repurchases of common stock
(20,565
)
(6,842
)
(8,841
)
Dividends and dividend equivalents paid on outstanding
shares and restricted stock units
(36,966
)
(36,257
)
(53,060
)
Excess tax benefits from equity awards
1,099
584
295
Net cash provided by (used for) financing activities
(125,113
)
(128,019
)
51,824
Effect of foreign currency exchange rate changes on cash and
cash equivalents
(2,179
)
1,648
(2,280
)
Change in cash and cash equivalents
(15,245
)
10,995
(44,993
)
Cash and cash equivalents, beginning of period
115,509
104,514
149,507
Cash and cash equivalents, end of period
$
100,264
$
115,509
$
104,514
Supplemental disclosure of cash flows:
Cash paid for interest
$
20,273
$
29,204
$
9,587
Cash paid for income taxes
$
43,703
$
53,228
$
36,350
Supplemental disclosure of non
-
cash investing and financing
activities:
Increase (decrease) in dividend equivalents payable on