Classmates.com 2010 Annual Report Download - page 46
Download and view the complete annual report
Please find page 46 of the 2010 Classmates.com annual report below. You can navigate through the pages in the report by either clicking on the pages listed below, or by using the keyword search tool below to find specific information within the annual report.-
 1
1 -
2
-
3
-
4
-
5
-
6
-
7
-
8
-
9
-
10
-
11
-
12
-
13
-
14
-
15
-
16
-
17
-
18
-
19
-
20
-
21
-
22
-
23
-
24
-
25
-
26
-
27
-
28
-
29
-
30
-
31
-
32
-
33
-
34
-
35
-
 36
36 -
 37
37 -
 38
38 -
 39
39 -
 40
40 -
 41
41 -
 42
42 -
 43
43 -
 44
44 -
 45
45 -
 46
46 -
 47
47 -
 48
48 -
 49
49 -
 50
50 -
 51
51 -
 52
52 -
 53
53 -
 54
54 -
 55
55 -
 56
56 -
57
-
58
-
59
-
60
-
61
-
62
-
63
-
64
-
65
-
66
-
67
-
68
-
69
-
70
-
71
-
72
-
73
-
74
-
75
-
76
-
77
-
78
-
79
-
80
-
81
-
82
-
83
-
84
-
85
-
86
-
87
-
88
-
89
-
90
-
91
-
92
-
93
-
94
-
95
-
96
-
97
-
98
-
99
-
100
-
101
-
102
-
103
-
104
-
105
-
106
-
107
-
108
-
109
-
110
-
111
-
112
-
113
-
114
-
115
-
116
-
117
-
118
-
119
-
120
-
121
-
122
-
123
-
124
-
125
-
126
-
127
-
128
-
129
-
130
-
131
-
132
-
133
-
134
-
135
-
136
-
137
-
138
-
139
-
140
-
141
-
142
-
143
-
144
-
145
-
146
-
147
-
148
-
149
-
150
-
151
-
152
-
153
-
154
-
155
-
156
-
157
-
158
-
159
-
160
-
161
-
162
-
163
-
164
-
165
-
166
-
167
-
168
-
169
-
170
-
171
-
172
-
173
-
174
-
175
-
176
-
177
-
178
-
179
-
180
-
181
-
182
-
183
-
184
-
185
-
186
-
187
-
188
-
189
-
190
-
191
-
192
-
193
-
194
-
195
-
196
-
197
-
198
-
199
-
200
-
201
-
202
-
203
-
204
-
205
-
206
-
207
-
208
-
209
-
210
-
211
-
212
-
213
-
214
-
215
-
216
-
217
-
218
-
219
-
220
-
221
-
222
-
223
-
224
-
225
-
226
-
227
-
228
-
229
-
230
-
231
-
232
-
233
-
234
-
235
-
236
-
237
-
238
-
239
-
240
-
241
-
242
-
243
-
244
-
245
-
246
-
247
-
248
-
249
-
250
-
251
-
252
-
253
-
254
-
255
-
256
-
257
-
258
-
259
-
260
-
261
-
262
-
263
-
264
-
265
-
266
-
267
-
268
-
269
-
270
-
271
-
272
-
273
-
274
-
275
-
276
-
277
-
278
-
279
-
280
-
281
-
282
-
283
-
284
-
285
-
286
-
287
-
288
-
289
-
290
-
291
-
292
-
293
-
294
-
295
-
296
-
297
-
298
-
299
-
300
-
301
-
302
-
303
-
304
-
305
-
306
-
307
-
308
-
309
-
310
-
311
-
312
-
313
-
314
-
315
-
316
-
317
-
318
-
319
-
320
-
321
-
322
-
323
-
324
-
325
-
326
-
327
-
328
-
329
-
330
-
331
-
332
-
333
 |
 |

Table of Contents
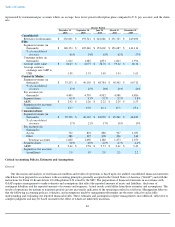
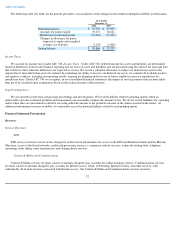
Key Business Metrics
We review a number of key business metrics to help us monitor our performance and trends affecting our businesses, and to develop
forecasts and budgets. These key measures are:
FTD Segment Metrics
Consumer Orders. We monitor the number of consumer orders for floral and gift products during a given period. Consumer orders are
orders delivered during the period that originated in the U.S. and Canada, primarily from the www.ftd.com website and the 1-800-SEND-FTD
telephone number, and in the U.K. and the Republic of Ireland, primarily from the www.interflora.co.uk and www.interflora.ie websites and
various telephone numbers. Orders originating with a florist or other retail location for delivery to consumers are not included. The number of
consumer orders received may fluctuate significantly from period to period due to seasonality resulting from the timing of key holidays; general
economic conditions; fluctuations in marketing expenditures on initiatives designed to attract new and retain existing customers; changes in
pricing for our floral, plant and specialty gift products or competitive offerings; new or terminated partnerships; and changing consumer
preferences, among other factors.
Average Order Value. We monitor the average value for consumer orders delivered in a given period, which we refer to as the average
order value. Average order value represents the average U.S. Dollar amount received for consumer orders delivered during a period. This
average U.S. Dollar amount is determined after translating local currency amounts received for orders delivered principally in the U.K. and the
Republic of Ireland into U.S. Dollars. Average order value includes merchandise revenue and shipping and service fees paid by the consumer,
less certain discounts and certain refunds. Average order values may fluctuate from period to period based on the average foreign currency
exchange rates; product mix; changes in merchandise pricing, shipping and service fees; levels of certain refunds issued; and discounts, among
other factors.
Content & Media and Communications Segment Metrics
Pay Accounts. We generate a significant portion of our revenues from our pay accounts and they represent one of the most important
drivers of our business model. A pay account is defined as a member who has subscribed to, and paid for, our Content & Media or
Communications services, and whose subscription has not terminated or expired. A pay account does not equate to a unique subscriber since one
subscriber could have several pay accounts. At any point in time, our pay account base includes a number of accounts receiving a free period of
service as either a promotion or retention tool and a number of accounts that have notified us that they are terminating their service but whose
service remains in effect. In general, the key metrics that affect our revenues from our pay accounts base include the number of pay accounts and
the average monthly revenue per pay account ("ARPU"). A pay account generally becomes a free account following the expiration or
termination of the related subscription.
ARPU. We monitor ARPU, which is a monthly measure calculated by dividing services revenues generated from the pay accounts of our
Content & Media or Communications segment, as applicable, for a period (after translation into U.S. Dollars) by the average number of segment
pay accounts for that period, divided by the number of months in that period. The average number of pay accounts is the simple average of the
number of pay accounts at the beginning and end of a period. ARPU may fluctuate significantly from period to period as a result of a variety of
factors, including, but not limited to, the extent to which promotional, discounted or retention pricing is used to attract new, or retain existing,
paying subscribers; changes in the mix of pay services and the related pricing plans; increases or decreases in the price of our services; the
timing of pay accounts being added or removed during a period; and the average foreign currency exchange rate between the U.S. Dollar and the
Euro.
44