Classmates.com 2010 Annual Report Download - page 108
Download and view the complete annual report
Please find page 108 of the 2010 Classmates.com annual report below. You can navigate through the pages in the report by either clicking on the pages listed below, or by using the keyword search tool below to find specific information within the annual report.-
 1
1 -
2
-
3
-
4
-
5
-
6
-
7
-
8
-
9
-
10
-
11
-
12
-
13
-
14
-
15
-
16
-
17
-
18
-
19
-
20
-
21
-
22
-
23
-
24
-
25
-
26
-
27
-
28
-
29
-
30
-
31
-
32
-
33
-
34
-
35
-
36
-
37
-
38
-
39
-
40
-
41
-
42
-
43
-
44
-
45
-
46
-
47
-
48
-
49
-
50
-
51
-
52
-
53
-
54
-
55
-
56
-
57
-
58
-
59
-
60
-
61
-
62
-
63
-
64
-
65
-
66
-
67
-
68
-
69
-
70
-
71
-
72
-
73
-
74
-
75
-
76
-
77
-
78
-
79
-
80
-
81
-
82
-
83
-
84
-
85
-
86
-
87
-
88
-
89
-
90
-
91
-
92
-
93
-
94
-
95
-
96
-
97
-
 98
98 -
 99
99 -
 100
100 -
 101
101 -
 102
102 -
 103
103 -
 104
104 -
 105
105 -
 106
106 -
 107
107 -
 108
108 -
 109
109 -
 110
110 -
 111
111 -
 112
112 -
 113
113 -
 114
114 -
 115
115 -
 116
116 -
 117
117 -
 118
118 -
119
-
120
-
121
-
122
-
123
-
124
-
125
-
126
-
127
-
128
-
129
-
130
-
131
-
132
-
133
-
134
-
135
-
136
-
137
-
138
-
139
-
140
-
141
-
142
-
143
-
144
-
145
-
146
-
147
-
148
-
149
-
150
-
151
-
152
-
153
-
154
-
155
-
156
-
157
-
158
-
159
-
160
-
161
-
162
-
163
-
164
-
165
-
166
-
167
-
168
-
169
-
170
-
171
-
172
-
173
-
174
-
175
-
176
-
177
-
178
-
179
-
180
-
181
-
182
-
183
-
184
-
185
-
186
-
187
-
188
-
189
-
190
-
191
-
192
-
193
-
194
-
195
-
196
-
197
-
198
-
199
-
200
-
201
-
202
-
203
-
204
-
205
-
206
-
207
-
208
-
209
-
210
-
211
-
212
-
213
-
214
-
215
-
216
-
217
-
218
-
219
-
220
-
221
-
222
-
223
-
224
-
225
-
226
-
227
-
228
-
229
-
230
-
231
-
232
-
233
-
234
-
235
-
236
-
237
-
238
-
239
-
240
-
241
-
242
-
243
-
244
-
245
-
246
-
247
-
248
-
249
-
250
-
251
-
252
-
253
-
254
-
255
-
256
-
257
-
258
-
259
-
260
-
261
-
262
-
263
-
264
-
265
-
266
-
267
-
268
-
269
-
270
-
271
-
272
-
273
-
274
-
275
-
276
-
277
-
278
-
279
-
280
-
281
-
282
-
283
-
284
-
285
-
286
-
287
-
288
-
289
-
290
-
291
-
292
-
293
-
294
-
295
-
296
-
297
-
298
-
299
-
300
-
301
-
302
-
303
-
304
-
305
-
306
-
307
-
308
-
309
-
310
-
311
-
312
-
313
-
314
-
315
-
316
-
317
-
318
-
319
-
320
-
321
-
322
-
323
-
324
-
325
-
326
-
327
-
328
-
329
-
330
-
331
-
332
-
333
 |
 |

Table of Contents
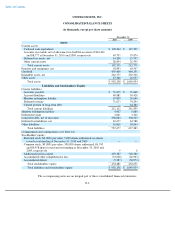
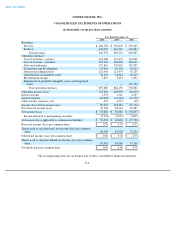
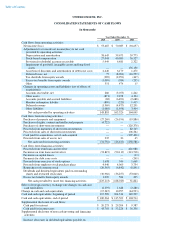
UNITED ONLINE, INC.
CONSOLIDATED STATEMENTS OF OPERATIONS
(in thousands, except per share amounts)
The accompanying notes are an integral part of these consolidated financial statements.
F-4
Year Ended December 31,
2010 2009 2008
Revenues:
Services
$
486,518
$
576,005
$
536,420
Products
434,035
414,127
132,983
Total revenues
920,553
990,132
669,403
Operating expenses:
Cost of revenues
—
services
101,688
112,491
114,818
Cost of revenues
—
products
327,963
304,868
100,069
Sales and marketing
175,865
202,810
172,207
Technology and development
55,381
64,158
56,512
General and administrative
112,041
121,474
92,219
Amortization of intangible assets
32,110
34,844
18,415
Restructuring charges
2,815
3,494
1,692
Impairment of goodwill, intangible assets and long
-
lived
assets
—
—
176,150
Total operating expenses
807,863
844,139
732,082
Operating income (loss)
112,690
145,993
(62,679
)
Interest income
1,673
1,545
4,527
Interest expense
(24,900
)
(33,524
)
(13,170
)
Other income (expense), net
452
4,215
(48
)
Income (loss) before income taxes
89,915
118,229
(71,370
)
Provision for income taxes
36,228
48,144
23,287
Net income (loss)
$
53,687
$
70,085
$
(94,657
)
Income allocated to participating securities
(3,233
)
(4,647
)
(3,065
)
Net income (loss) applicable to common stockholders
$
50,454
$
65,438
$
(97,722
)
Basic net income (loss) per common share
$
0.58
$
0.78
$
(1.33
)
Shares used to calculate basic net income (loss) per common
share
86,429
83,698
73,236
Diluted net income (loss) per common share
$
0.58
$
0.78
$
(1.33
)
Shares used to calculate diluted net income (loss) per common
share
87,062
84,386
73,236
Dividends paid per common share
$
0.40
$
0.40
$
0.70