Classmates.com 2010 Annual Report Download - page 79
Download and view the complete annual report
Please find page 79 of the 2010 Classmates.com annual report below. You can navigate through the pages in the report by either clicking on the pages listed below, or by using the keyword search tool below to find specific information within the annual report.-
 1
1 -
2
-
3
-
4
-
5
-
6
-
7
-
8
-
9
-
10
-
11
-
12
-
13
-
14
-
15
-
16
-
17
-
18
-
19
-
20
-
21
-
22
-
23
-
24
-
25
-
26
-
27
-
28
-
29
-
30
-
31
-
32
-
33
-
34
-
35
-
36
-
37
-
38
-
39
-
40
-
41
-
42
-
43
-
44
-
45
-
46
-
47
-
48
-
49
-
50
-
51
-
52
-
53
-
54
-
55
-
56
-
57
-
58
-
59
-
60
-
61
-
62
-
63
-
64
-
65
-
66
-
67
-
68
-
 69
69 -
 70
70 -
 71
71 -
 72
72 -
 73
73 -
 74
74 -
 75
75 -
 76
76 -
 77
77 -
 78
78 -
 79
79 -
 80
80 -
 81
81 -
 82
82 -
 83
83 -
 84
84 -
 85
85 -
 86
86 -
 87
87 -
 88
88 -
 89
89 -
90
-
91
-
92
-
93
-
94
-
95
-
96
-
97
-
98
-
99
-
100
-
101
-
102
-
103
-
104
-
105
-
106
-
107
-
108
-
109
-
110
-
111
-
112
-
113
-
114
-
115
-
116
-
117
-
118
-
119
-
120
-
121
-
122
-
123
-
124
-
125
-
126
-
127
-
128
-
129
-
130
-
131
-
132
-
133
-
134
-
135
-
136
-
137
-
138
-
139
-
140
-
141
-
142
-
143
-
144
-
145
-
146
-
147
-
148
-
149
-
150
-
151
-
152
-
153
-
154
-
155
-
156
-
157
-
158
-
159
-
160
-
161
-
162
-
163
-
164
-
165
-
166
-
167
-
168
-
169
-
170
-
171
-
172
-
173
-
174
-
175
-
176
-
177
-
178
-
179
-
180
-
181
-
182
-
183
-
184
-
185
-
186
-
187
-
188
-
189
-
190
-
191
-
192
-
193
-
194
-
195
-
196
-
197
-
198
-
199
-
200
-
201
-
202
-
203
-
204
-
205
-
206
-
207
-
208
-
209
-
210
-
211
-
212
-
213
-
214
-
215
-
216
-
217
-
218
-
219
-
220
-
221
-
222
-
223
-
224
-
225
-
226
-
227
-
228
-
229
-
230
-
231
-
232
-
233
-
234
-
235
-
236
-
237
-
238
-
239
-
240
-
241
-
242
-
243
-
244
-
245
-
246
-
247
-
248
-
249
-
250
-
251
-
252
-
253
-
254
-
255
-
256
-
257
-
258
-
259
-
260
-
261
-
262
-
263
-
264
-
265
-
266
-
267
-
268
-
269
-
270
-
271
-
272
-
273
-
274
-
275
-
276
-
277
-
278
-
279
-
280
-
281
-
282
-
283
-
284
-
285
-
286
-
287
-
288
-
289
-
290
-
291
-
292
-
293
-
294
-
295
-
296
-
297
-
298
-
299
-
300
-
301
-
302
-
303
-
304
-
305
-
306
-
307
-
308
-
309
-
310
-
311
-
312
-
313
-
314
-
315
-
316
-
317
-
318
-
319
-
320
-
321
-
322
-
323
-
324
-
325
-
326
-
327
-
328
-
329
-
330
-
331
-
332
-
333
 |
 |

Table of Contents
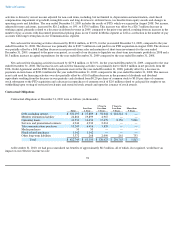
for our domestic online nostalgia services business and a $1.1 million increase in capital expenditures. We currently anticipate expending
between $4 million to $6 million on additional purchases of rights, content and intellectual property in 2011, primarily for the purpose of adding
new content.
Capital expenditures for the year ended December 31, 2010 were $27.3 million. We currently anticipate that our total capital expenditures
for 2011 will be in the range of $25 million to $30 million. The actual amount of future capital expenditures may fluctuate due to a number of
factors including, without limitation, potential future acquisitions and new business initiatives, which are difficult to predict and which could
change significantly over time. Additionally, technological advances may require us to make capital expenditures to develop or acquire new
equipment or technology in order to replace aging or technologically obsolete equipment.
Net cash used for financing activities decreased by $2.9 million, or 2%, for the year ended December 31, 2010, compared to the year ended
December 31, 2009. The decrease in net cash used for financing activities was primarily due to a decrease in debt payments of $15.3 million, an
increase in proceeds from the exercise of stock options and proceeds from the employee stock purchase plans of $1.5 million, and an increase in
excess tax benefits from equity awards of $0.5 million. The decrease was partially offset by an increase in common stock repurchases of
$13.7 million, including $11.0 million under our common stock repurchase program, and an increase in the payment of dividends and dividend
equivalents of $0.7 million for the year ended December 31, 2010, compared to the prior-year period.
The payment of dividends and dividend equivalents is a cash outflow from financing activities. In February, April, July and October 2010,
United Online, Inc.'s Board of Directors declared quarterly cash dividends of $0.10 per share of common stock. The dividends were paid on
February 26, 2010, May 28, 2010, August 31, 2010, and November 30, 2010, respectively, and totaled $9.1 million, $9.4 million, $9.3 million,
and $9.2 million, respectively, including dividend equivalents paid on nonvested restricted stock units. In January 2011, United Online, Inc.'s
Board of Directors declared a quarterly cash dividend of $0.10 per share of common stock. The record date for the dividend was February 14,
2011 and the dividend will be paid on February 28, 2011. The payment of future dividends is discretionary and is subject to determination by
United Online, Inc.'s Board of Directors each quarter following its review of our financial performance and other factors. In accordance with the
terms of the FTD Credit Agreement, cash flows at FTD will, in general, not be available to United Online, Inc. or our segments other than the
FTD segment.
Future cash flows from financing activities may also be affected by our repurchases of our common stock. United Online, Inc.'s Board of
Directors authorized a common stock repurchase program (the "Program") that allowed us to repurchase shares of our common stock through
open market or privately negotiated transactions based on prevailing market conditions and other factors through December 31, 2010. From
August 2001 through December 31, 2010, we repurchased a total of $150.2 million of our common stock under the Program and at
December 31, 2010, the remaining amount available under the Program was $49.8 million. In February 2011, the Board of Directors extended
the Program through December 31, 2011 and increased the amount authorized to $80 million.
Cash flows from financing activities may also be negatively impacted by the withholding of a portion of shares underlying the restricted
stock units and stock awards we grant to employees. In general, we currently do not collect the applicable required employee withholding taxes
from employees upon vesting of restricted stock units and upon the issuance of stock awards. Instead, we automatically withhold, from the
restricted stock units that vest and the stock awards that are issued, the portion of those shares with a fair market value equal to the amount of the
required employee withholding taxes due. We then pay the applicable withholding taxes in cash. The withholding of these shares, although
accounted for as a common stock repurchase, does not reduce the amount available under the Program. Similar to repurchases of common stock
under the Program, the net effect of such
76