Classmates.com 2010 Annual Report Download - page 136
Download and view the complete annual report
Please find page 136 of the 2010 Classmates.com annual report below. You can navigate through the pages in the report by either clicking on the pages listed below, or by using the keyword search tool below to find specific information within the annual report.-
 1
1 -
2
-
3
-
4
-
5
-
6
-
7
-
8
-
9
-
10
-
11
-
12
-
13
-
14
-
15
-
16
-
17
-
18
-
19
-
20
-
21
-
22
-
23
-
24
-
25
-
26
-
27
-
28
-
29
-
30
-
31
-
32
-
33
-
34
-
35
-
36
-
37
-
38
-
39
-
40
-
41
-
42
-
43
-
44
-
45
-
46
-
47
-
48
-
49
-
50
-
51
-
52
-
53
-
54
-
55
-
56
-
57
-
58
-
59
-
60
-
61
-
62
-
63
-
64
-
65
-
66
-
67
-
68
-
69
-
70
-
71
-
72
-
73
-
74
-
75
-
76
-
77
-
78
-
79
-
80
-
81
-
82
-
83
-
84
-
85
-
86
-
87
-
88
-
89
-
90
-
91
-
92
-
93
-
94
-
95
-
96
-
97
-
98
-
99
-
100
-
101
-
102
-
103
-
104
-
105
-
106
-
107
-
108
-
109
-
110
-
111
-
112
-
113
-
114
-
115
-
116
-
117
-
118
-
119
-
120
-
121
-
122
-
123
-
124
-
125
-
 126
126 -
 127
127 -
 128
128 -
 129
129 -
 130
130 -
 131
131 -
 132
132 -
 133
133 -
 134
134 -
 135
135 -
 136
136 -
 137
137 -
 138
138 -
 139
139 -
 140
140 -
 141
141 -
 142
142 -
 143
143 -
 144
144 -
 145
145 -
 146
146 -
147
-
148
-
149
-
150
-
151
-
152
-
153
-
154
-
155
-
156
-
157
-
158
-
159
-
160
-
161
-
162
-
163
-
164
-
165
-
166
-
167
-
168
-
169
-
170
-
171
-
172
-
173
-
174
-
175
-
176
-
177
-
178
-
179
-
180
-
181
-
182
-
183
-
184
-
185
-
186
-
187
-
188
-
189
-
190
-
191
-
192
-
193
-
194
-
195
-
196
-
197
-
198
-
199
-
200
-
201
-
202
-
203
-
204
-
205
-
206
-
207
-
208
-
209
-
210
-
211
-
212
-
213
-
214
-
215
-
216
-
217
-
218
-
219
-
220
-
221
-
222
-
223
-
224
-
225
-
226
-
227
-
228
-
229
-
230
-
231
-
232
-
233
-
234
-
235
-
236
-
237
-
238
-
239
-
240
-
241
-
242
-
243
-
244
-
245
-
246
-
247
-
248
-
249
-
250
-
251
-
252
-
253
-
254
-
255
-
256
-
257
-
258
-
259
-
260
-
261
-
262
-
263
-
264
-
265
-
266
-
267
-
268
-
269
-
270
-
271
-
272
-
273
-
274
-
275
-
276
-
277
-
278
-
279
-
280
-
281
-
282
-
283
-
284
-
285
-
286
-
287
-
288
-
289
-
290
-
291
-
292
-
293
-
294
-
295
-
296
-
297
-
298
-
299
-
300
-
301
-
302
-
303
-
304
-
305
-
306
-
307
-
308
-
309
-
310
-
311
-
312
-
313
-
314
-
315
-
316
-
317
-
318
-
319
-
320
-
321
-
322
-
323
-
324
-
325
-
326
-
327
-
328
-
329
-
330
-
331
-
332
-
333
 |
 |

Table of Contents
UNITED ONLINE, INC.
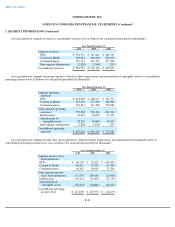
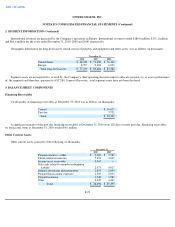
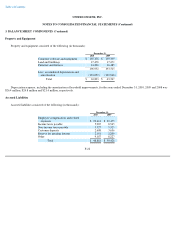
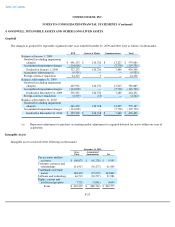
NOTES TO CONSOLIDATED FINANCIAL STATEMENTS (Continued)
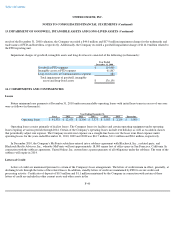
8. STOCK-BASED COMPENSATION PLANS (Continued)
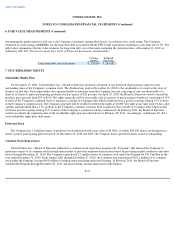
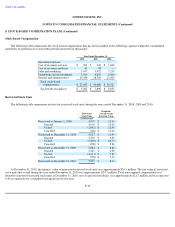
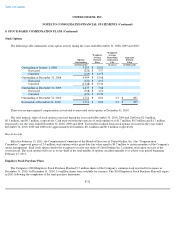
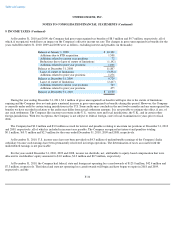
Stock-Based Compensation
The following table summarizes the stock-based compensation that has been included in the following captions within the consolidated
statements of operations for each of the periods presented (in thousands):
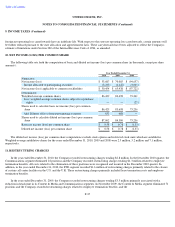
Restricted Stock Units
The following table summarizes activity for restricted stock units during the years ended December 31, 2008, 2009 and 2010:
At December 31, 2010, the intrinsic value of nonvested restricted stock units was approximately $36.5 million. The fair value of restricted
stock units that vested during the year ended December 31, 2010 was approximately $24.7 million. Total unrecognized compensation cost
related to nonvested restricted stock units at December 31, 2010, net of expected forfeitures, was approximately $21.7 million and was expected
to be recognized over a weighted-average period of one year.
F-30
Year Ended December 31,
2010
2009
2008
Operating expenses:
Cost of revenues
-
services
$
502
$
943
$
1,049
Cost of revenues
-
products
41
43
—
Sales and marketing
3,957
5,472
7,250
Technology and development
3,109
4,856
6,410
General and administrative
19,434
28,766
21,818
Total stock-based
compensation
$
27,043
$
40,080
$
36,527
Tax benefit recognized
$
5,262
$
7,890
$
8,952
Restricted
Stock Units
Weighted-
Average Grant
Date Fair Value
(in thousands)
Nonvested at January 1, 2008
4,978
$
12.65
Granted
4,639
$
10.18
Vested
(1,942
)
$
12.49
Canceled
(760
)
$
12.44
Nonvested at December 31, 2008
6,915
$
11.49
Granted
3,356
$
6.09
Vested
(2,890
)
$
10.72
Canceled
(500
)
$
9.86
Nonvested at December 31, 2009
6,881
$
8.84
Granted
3,245
$
6.08
Vested
(4,011
)
$
7.83
Canceled
(578
)
$
7.19
Nonvested at December 31, 2010
5,537
$
8.13