Classmates.com 2010 Annual Report Download - page 58
Download and view the complete annual report
Please find page 58 of the 2010 Classmates.com annual report below. You can navigate through the pages in the report by either clicking on the pages listed below, or by using the keyword search tool below to find specific information within the annual report.-
 1
1 -
2
-
3
-
4
-
5
-
6
-
7
-
8
-
9
-
10
-
11
-
12
-
13
-
14
-
15
-
16
-
17
-
18
-
19
-
20
-
21
-
22
-
23
-
24
-
25
-
26
-
27
-
28
-
29
-
30
-
31
-
32
-
33
-
34
-
35
-
36
-
37
-
38
-
39
-
40
-
41
-
42
-
43
-
44
-
45
-
46
-
47
-
 48
48 -
 49
49 -
 50
50 -
 51
51 -
 52
52 -
 53
53 -
 54
54 -
 55
55 -
 56
56 -
 57
57 -
 58
58 -
 59
59 -
 60
60 -
 61
61 -
 62
62 -
 63
63 -
 64
64 -
 65
65 -
 66
66 -
 67
67 -
 68
68 -
69
-
70
-
71
-
72
-
73
-
74
-
75
-
76
-
77
-
78
-
79
-
80
-
81
-
82
-
83
-
84
-
85
-
86
-
87
-
88
-
89
-
90
-
91
-
92
-
93
-
94
-
95
-
96
-
97
-
98
-
99
-
100
-
101
-
102
-
103
-
104
-
105
-
106
-
107
-
108
-
109
-
110
-
111
-
112
-
113
-
114
-
115
-
116
-
117
-
118
-
119
-
120
-
121
-
122
-
123
-
124
-
125
-
126
-
127
-
128
-
129
-
130
-
131
-
132
-
133
-
134
-
135
-
136
-
137
-
138
-
139
-
140
-
141
-
142
-
143
-
144
-
145
-
146
-
147
-
148
-
149
-
150
-
151
-
152
-
153
-
154
-
155
-
156
-
157
-
158
-
159
-
160
-
161
-
162
-
163
-
164
-
165
-
166
-
167
-
168
-
169
-
170
-
171
-
172
-
173
-
174
-
175
-
176
-
177
-
178
-
179
-
180
-
181
-
182
-
183
-
184
-
185
-
186
-
187
-
188
-
189
-
190
-
191
-
192
-
193
-
194
-
195
-
196
-
197
-
198
-
199
-
200
-
201
-
202
-
203
-
204
-
205
-
206
-
207
-
208
-
209
-
210
-
211
-
212
-
213
-
214
-
215
-
216
-
217
-
218
-
219
-
220
-
221
-
222
-
223
-
224
-
225
-
226
-
227
-
228
-
229
-
230
-
231
-
232
-
233
-
234
-
235
-
236
-
237
-
238
-
239
-
240
-
241
-
242
-
243
-
244
-
245
-
246
-
247
-
248
-
249
-
250
-
251
-
252
-
253
-
254
-
255
-
256
-
257
-
258
-
259
-
260
-
261
-
262
-
263
-
264
-
265
-
266
-
267
-
268
-
269
-
270
-
271
-
272
-
273
-
274
-
275
-
276
-
277
-
278
-
279
-
280
-
281
-
282
-
283
-
284
-
285
-
286
-
287
-
288
-
289
-
290
-
291
-
292
-
293
-
294
-
295
-
296
-
297
-
298
-
299
-
300
-
301
-
302
-
303
-
304
-
305
-
306
-
307
-
308
-
309
-
310
-
311
-
312
-
313
-
314
-
315
-
316
-
317
-
318
-
319
-
320
-
321
-
322
-
323
-
324
-
325
-
326
-
327
-
328
-
329
-
330
-
331
-
332
-
333
 |
 |

Table of Contents
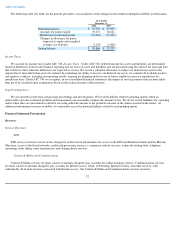
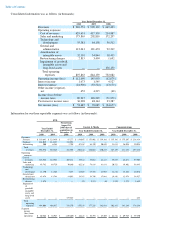
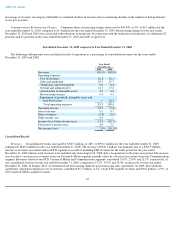
Consolidated information was as follows (in thousands):
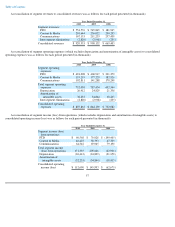
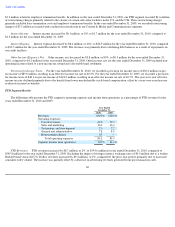
Information for our three reportable segments was as follows (in thousands):
Year Ended December 31,
2010
2009
2008
Revenues
$
920,553
$
990,132
$
669,403
Operating expenses:
Cost of revenues
429,651
417,359
214,887
Sales and marketing
175,865
202,810
172,207
Technology and
development
55,381
64,158
56,512
General and
administrative
112,041
121,474
92,219
Amortization of
intangible assets
32,110
34,844
18,415
Restructuring charges
2,815
3,494
1,692
Impairment of goodwill,
intangible assets and
long
-
lived assets
—
—
176,150
Total operating
expenses
807,863
844,139
732,082
Operating income (loss)
$
112,690
145,993
(62,679
)
Interest income
1,673
1,545
4,527
Interest expense
(24,900
)
(33,524
)
(13,170
)
Other income (expense),
net
452
4,215
(48
)
Income (loss) before
income taxes
89,915
118,229
(71,370
)
Provision for income taxes
36,228
48,144
23,287
Net income (loss)
$
53,687
$
70,085
$
(94,657
)
FTD
Period from
August 26,
2008 (date of
acquisition) to
December 31,
2008
Content & Media
Communications
Year Ended
December 31,
Year Ended December 31,
Year Ended December 31,
2010
2009
2010
2009
2008
2010
2009
2008
Revenues:
Services
$
119,641
$
125,430
$
47,277
$
134,055
$
151,902
$
139,386
$
135,342
$
175,207
$
218,414
Products
434,035
414,127
132,983
—
—
—
—
—
—
Advertising
900
6,288
1,705
67,589
84,120
90,849
31,811
36,026
39,024
Total
revenues
554,576
545,845
181,965
201,644
236,022
230,235
167,153
211,233
257,438
Operating
expenses:
Cost of
revenues
343,988
323,581
107,131
35,514
35,014
41,113
39,573
48,671
57,905
Sales and
marketing
93,782
89,720
30,640
62,226
74,819
81,818
20,521
39,802
59,445
Technology
and
development
11,190
11,868
3,677
22,803
25,535
21,969
12,284
18,468
24,036
General and
administrative
43,474
43,748
14,055
34,767
39,740
37,986
29,101
32,974
34,927
Restructuring
charges
1,574
—
—
(
91
)
2,121
40
1,332
1,373
1,652
Impairment
of
goodwill,
intangible
assets and
long-lived
assets
—
—
175,867
—
—
—
—
—
283
Total
operating
expenses
494,008
468,917
331,370
155,219
177,229
182,926
102,811
141,288
178,248
Segment
income
(loss) from
operations
$
60,568
$
76,928
$
(149,405
)
$
46,425
$
58,793
$
47,309
$
64,342
$
69,945
$
79,190