Classmates.com 2010 Annual Report Download - page 75
Download and view the complete annual report
Please find page 75 of the 2010 Classmates.com annual report below. You can navigate through the pages in the report by either clicking on the pages listed below, or by using the keyword search tool below to find specific information within the annual report.-
 1
1 -
2
-
3
-
4
-
5
-
6
-
7
-
8
-
9
-
10
-
11
-
12
-
13
-
14
-
15
-
16
-
17
-
18
-
19
-
20
-
21
-
22
-
23
-
24
-
25
-
26
-
27
-
28
-
29
-
30
-
31
-
32
-
33
-
34
-
35
-
36
-
37
-
38
-
39
-
40
-
41
-
42
-
43
-
44
-
45
-
46
-
47
-
48
-
49
-
50
-
51
-
52
-
53
-
54
-
55
-
56
-
57
-
58
-
59
-
60
-
61
-
62
-
63
-
64
-
 65
65 -
 66
66 -
 67
67 -
 68
68 -
 69
69 -
 70
70 -
 71
71 -
 72
72 -
 73
73 -
 74
74 -
 75
75 -
 76
76 -
 77
77 -
 78
78 -
 79
79 -
 80
80 -
 81
81 -
 82
82 -
 83
83 -
 84
84 -
 85
85 -
86
-
87
-
88
-
89
-
90
-
91
-
92
-
93
-
94
-
95
-
96
-
97
-
98
-
99
-
100
-
101
-
102
-
103
-
104
-
105
-
106
-
107
-
108
-
109
-
110
-
111
-
112
-
113
-
114
-
115
-
116
-
117
-
118
-
119
-
120
-
121
-
122
-
123
-
124
-
125
-
126
-
127
-
128
-
129
-
130
-
131
-
132
-
133
-
134
-
135
-
136
-
137
-
138
-
139
-
140
-
141
-
142
-
143
-
144
-
145
-
146
-
147
-
148
-
149
-
150
-
151
-
152
-
153
-
154
-
155
-
156
-
157
-
158
-
159
-
160
-
161
-
162
-
163
-
164
-
165
-
166
-
167
-
168
-
169
-
170
-
171
-
172
-
173
-
174
-
175
-
176
-
177
-
178
-
179
-
180
-
181
-
182
-
183
-
184
-
185
-
186
-
187
-
188
-
189
-
190
-
191
-
192
-
193
-
194
-
195
-
196
-
197
-
198
-
199
-
200
-
201
-
202
-
203
-
204
-
205
-
206
-
207
-
208
-
209
-
210
-
211
-
212
-
213
-
214
-
215
-
216
-
217
-
218
-
219
-
220
-
221
-
222
-
223
-
224
-
225
-
226
-
227
-
228
-
229
-
230
-
231
-
232
-
233
-
234
-
235
-
236
-
237
-
238
-
239
-
240
-
241
-
242
-
243
-
244
-
245
-
246
-
247
-
248
-
249
-
250
-
251
-
252
-
253
-
254
-
255
-
256
-
257
-
258
-
259
-
260
-
261
-
262
-
263
-
264
-
265
-
266
-
267
-
268
-
269
-
270
-
271
-
272
-
273
-
274
-
275
-
276
-
277
-
278
-
279
-
280
-
281
-
282
-
283
-
284
-
285
-
286
-
287
-
288
-
289
-
290
-
291
-
292
-
293
-
294
-
295
-
296
-
297
-
298
-
299
-
300
-
301
-
302
-
303
-
304
-
305
-
306
-
307
-
308
-
309
-
310
-
311
-
312
-
313
-
314
-
315
-
316
-
317
-
318
-
319
-
320
-
321
-
322
-
323
-
324
-
325
-
326
-
327
-
328
-
329
-
330
-
331
-
332
-
333
 |
 |

Table of Contents
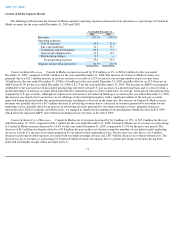
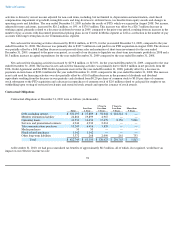
Content & Media Sales and Marketing Expenses. Content & Media sales and marketing expenses decreased by $7.0 million, or 9%, to
$74.8 million for the year ended December 31, 2009, compared to $81.8 million for the year ended December 31, 2008. Content & Media sales
and marketing expenses as a percentage of Content & Media revenues decreased to 31.7% for the year ended December 31, 2009, compared to
35.5% for the prior-year period. The decrease of $7.0 million was largely the result of a $5.8 million decrease in marketing costs related to
acquiring new online nostalgia services members and online loyalty marketing members. The decrease was also due to a $1.2 million decrease in
personnel-and overhead-related expenses. The decrease in Content & Media sales and marketing expenses as a percentage of Content & Media
revenues was mainly due to a reduction in sales commissions as a result of a decline in revenues from our online loyalty marketing service and
an increase in revenues from our international online nostalgia services without a corresponding increase in related sales and marketing costs.
Content & Media Technology and Development Expenses. Content & Media technology and development expenses increased by
$3.6 million, or 16%, to $25.5 million, for the year ended December 31, 2009, compared to $22.0 million for the year ended December 31, 2008.
Content & Media technology and development expenses as a percentage of Content & Media revenues increased to 10.8% for the year ended
December 31, 2009, compared to 9.5% for the prior-year period. The increase in expenses was primarily due to a $1.8 million increase in
overhead-related expenses and a $1.6 million increase in personnel-related expenses.
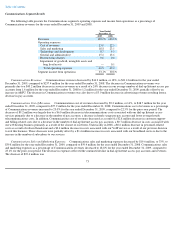
Content & Media General and Administrative Expenses. Content & Media general and administrative expenses increased by
$1.8 million, or 5%, to $39.7 million for the year ended December 31, 2009, compared to $38.0 million for the year ended December 31, 2008.
Content & Media general and administrative expenses as a percentage of Content & Media revenues increased to 16.8% for the year ended
December 31, 2009, compared to 16.5% for the prior-year period. The increase of $1.8 million was primarily due to a $3.3 million non-income
tax favorable settlement in 2008, a $2.2 million charge in the quarter ended December 31, 2009 related to a reserve for a pending lawsuit, a
$1.0 million increase in professional services and consulting fees and a $0.9 million increase in personnel-related expenses. The increase was
partially offset by the expensing of $3.9 million in deferred transaction costs related to the potential initial public offering of Classmates Media
Corporation in the year ended December 31, 2008, a $1.5 million decrease in 2009 in recruiting and relocation-related expenses and a
$0.4 million decrease in overhead-related expenses.
Content & Media Restructuring Charges. Content & Media restructuring charges totaled $2.1 million for the year ended December 31,
2009. Content & Media restructuring charges totaled $40,000 for the year ended December 31, 2008. Restructuring charges for the year ended
December 31, 2009 were associated with a reduction in headcount in the fourth quarter of 2009. In connection with this reduction in headcount,
we eliminated 71 positions.
72