Classmates.com 2010 Annual Report Download - page 78
Download and view the complete annual report
Please find page 78 of the 2010 Classmates.com annual report below. You can navigate through the pages in the report by either clicking on the pages listed below, or by using the keyword search tool below to find specific information within the annual report.-
 1
1 -
2
-
3
-
4
-
5
-
6
-
7
-
8
-
9
-
10
-
11
-
12
-
13
-
14
-
15
-
16
-
17
-
18
-
19
-
20
-
21
-
22
-
23
-
24
-
25
-
26
-
27
-
28
-
29
-
30
-
31
-
32
-
33
-
34
-
35
-
36
-
37
-
38
-
39
-
40
-
41
-
42
-
43
-
44
-
45
-
46
-
47
-
48
-
49
-
50
-
51
-
52
-
53
-
54
-
55
-
56
-
57
-
58
-
59
-
60
-
61
-
62
-
63
-
64
-
65
-
66
-
67
-
 68
68 -
 69
69 -
 70
70 -
 71
71 -
 72
72 -
 73
73 -
 74
74 -
 75
75 -
 76
76 -
 77
77 -
 78
78 -
 79
79 -
 80
80 -
 81
81 -
 82
82 -
 83
83 -
 84
84 -
 85
85 -
 86
86 -
 87
87 -
 88
88 -
89
-
90
-
91
-
92
-
93
-
94
-
95
-
96
-
97
-
98
-
99
-
100
-
101
-
102
-
103
-
104
-
105
-
106
-
107
-
108
-
109
-
110
-
111
-
112
-
113
-
114
-
115
-
116
-
117
-
118
-
119
-
120
-
121
-
122
-
123
-
124
-
125
-
126
-
127
-
128
-
129
-
130
-
131
-
132
-
133
-
134
-
135
-
136
-
137
-
138
-
139
-
140
-
141
-
142
-
143
-
144
-
145
-
146
-
147
-
148
-
149
-
150
-
151
-
152
-
153
-
154
-
155
-
156
-
157
-
158
-
159
-
160
-
161
-
162
-
163
-
164
-
165
-
166
-
167
-
168
-
169
-
170
-
171
-
172
-
173
-
174
-
175
-
176
-
177
-
178
-
179
-
180
-
181
-
182
-
183
-
184
-
185
-
186
-
187
-
188
-
189
-
190
-
191
-
192
-
193
-
194
-
195
-
196
-
197
-
198
-
199
-
200
-
201
-
202
-
203
-
204
-
205
-
206
-
207
-
208
-
209
-
210
-
211
-
212
-
213
-
214
-
215
-
216
-
217
-
218
-
219
-
220
-
221
-
222
-
223
-
224
-
225
-
226
-
227
-
228
-
229
-
230
-
231
-
232
-
233
-
234
-
235
-
236
-
237
-
238
-
239
-
240
-
241
-
242
-
243
-
244
-
245
-
246
-
247
-
248
-
249
-
250
-
251
-
252
-
253
-
254
-
255
-
256
-
257
-
258
-
259
-
260
-
261
-
262
-
263
-
264
-
265
-
266
-
267
-
268
-
269
-
270
-
271
-
272
-
273
-
274
-
275
-
276
-
277
-
278
-
279
-
280
-
281
-
282
-
283
-
284
-
285
-
286
-
287
-
288
-
289
-
290
-
291
-
292
-
293
-
294
-
295
-
296
-
297
-
298
-
299
-
300
-
301
-
302
-
303
-
304
-
305
-
306
-
307
-
308
-
309
-
310
-
311
-
312
-
313
-
314
-
315
-
316
-
317
-
318
-
319
-
320
-
321
-
322
-
323
-
324
-
325
-
326
-
327
-
328
-
329
-
330
-
331
-
332
-
333
 |
 |

Table of Contents
the term loan B facility is either the prime rate plus 3.50% per annum, or LIBOR plus 4.50% per annum (with a LIBOR floor of 3.00%), in each
case, with step-downs in the interest rate depending on FTD's leverage ratio. In addition, there is a commitment fee equal to 0.50% per annum
(with step-downs in the commitment fee depending on FTD's leverage ratio) on the unused portion of the revolving credit facility. The FTD
Credit Agreement is guaranteed by UNOL Intermediate, Inc. and substantially all of the domestic subsidiaries of FTD and is secured by
substantially all of the assets of FTD and such subsidiaries, including a pledge of all of the outstanding capital stock owned by FTD and such
guarantors (provided that no more than 66% of the capital stock of any foreign subsidiary is pledged or otherwise secures the FTD Credit
Agreement). The FTD Credit Agreement contains customary representations and warranties, events of default, affirmative covenants and
negative covenants that, among other things, require FTD not to exceed a maximum leverage ratio and to maintain a minimum fixed charge
coverage ratio and imposes restrictions and limitations on, among other things, capital expenditures, investments, dividends, asset sales, and the
incurrence of additional debt and liens. On the date of the FTD acquisition, term loan A and term loan B under the FTD Credit Agreement were
fully funded.
In connection with the closing of the FTD acquisition, all of the approximately $122.1 million of outstanding borrowings under FTD's
existing credit facilities were repaid. In addition, FTD, Inc. ("FTDI"), a Delaware corporation and wholly-owned subsidiary of FTD Group, Inc.,
repurchased approximately $170.0 million aggregate principal amount of its 7.75% Senior Subordinated Notes due 2014 (the "FTDI Notes")
tendered pursuant to its offer to repurchase all of the approximately $170.1 million outstanding principal amount of FTDI Notes, which
purchased FTDI Notes were then canceled. Substantially concurrently with the closing of the FTD acquisition, we effected a covenant
defeasance with respect to the balance of the FTDI Notes pursuant to the terms of the indenture governing the FTDI Notes.
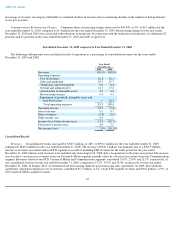
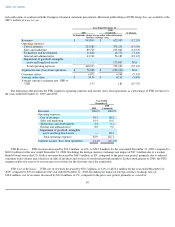
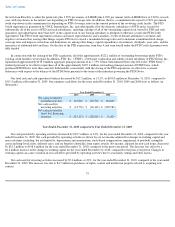
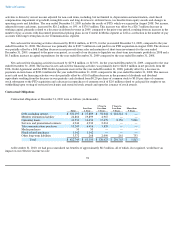
Our total cash and cash equivalents balance decreased by $15.2 million, or 13.2%, to $100.3 million at December 31, 2010, compared to
$115.5 million at December 31, 2009. Our summary cash flows for the years ended December 31, 2010, 2009 and 2008 were as follows (in
thousands):
Year Ended December 31, 2010 compared to Year Ended December 31, 2009
Net cash provided by operating activities decreased by $19.7 million, or 12%, for the year ended December 31, 2010, compared to the year
ended December 31, 2009. Net cash provided by operating activities is driven by our net income adjusted for changes in working capital and
non-cash items, including, but not limited to, depreciation and amortization, stock-based compensation, impairment of goodwill, intangible
assets and long-lived assets, deferred taxes, and tax benefits (shortfalls) from equity awards. Net income, adjusted for non-cash items, decreased
by $22.1 million to $148.4 million for the year ended December 31, 2010, compared to the prior-year period. The decrease was offset by a
$2.4 million increase in the change in working capital for the year ended December 31, 2010, compared to the prior-year period. Changes in
working capital can cause variation in our cash flows provided by operating activities due to seasonality, timing and other factors.
Net cash used for investing activities increased by $5.6 million, or 21%, for the year ended December 31, 2010, compared to the year ended
December 31, 2009. The increase was due to $4.7 million in purchases of rights, content and intellectual property related to acquiring new
content
75
Year Ended December 31,
2010
2009
2008
Net cash provided by
operating activities
$
143,803
$
163,526
$
164,049
Net cash used for
investing activities
$
(31,756
)
$
(26,160
)
$
(258,586
)
Net cash provided by
(used for) financing
activities
$
(125,113
)
$
(128,019
)
$
51,824