Classmates.com 2010 Annual Report Download - page 62
Download and view the complete annual report
Please find page 62 of the 2010 Classmates.com annual report below. You can navigate through the pages in the report by either clicking on the pages listed below, or by using the keyword search tool below to find specific information within the annual report.-
 1
1 -
2
-
3
-
4
-
5
-
6
-
7
-
8
-
9
-
10
-
11
-
12
-
13
-
14
-
15
-
16
-
17
-
18
-
19
-
20
-
21
-
22
-
23
-
24
-
25
-
26
-
27
-
28
-
29
-
30
-
31
-
32
-
33
-
34
-
35
-
36
-
37
-
38
-
39
-
40
-
41
-
42
-
43
-
44
-
45
-
46
-
47
-
48
-
49
-
50
-
51
-
 52
52 -
 53
53 -
 54
54 -
 55
55 -
 56
56 -
 57
57 -
 58
58 -
 59
59 -
 60
60 -
 61
61 -
 62
62 -
 63
63 -
 64
64 -
 65
65 -
 66
66 -
 67
67 -
 68
68 -
 69
69 -
 70
70 -
 71
71 -
 72
72 -
73
-
74
-
75
-
76
-
77
-
78
-
79
-
80
-
81
-
82
-
83
-
84
-
85
-
86
-
87
-
88
-
89
-
90
-
91
-
92
-
93
-
94
-
95
-
96
-
97
-
98
-
99
-
100
-
101
-
102
-
103
-
104
-
105
-
106
-
107
-
108
-
109
-
110
-
111
-
112
-
113
-
114
-
115
-
116
-
117
-
118
-
119
-
120
-
121
-
122
-
123
-
124
-
125
-
126
-
127
-
128
-
129
-
130
-
131
-
132
-
133
-
134
-
135
-
136
-
137
-
138
-
139
-
140
-
141
-
142
-
143
-
144
-
145
-
146
-
147
-
148
-
149
-
150
-
151
-
152
-
153
-
154
-
155
-
156
-
157
-
158
-
159
-
160
-
161
-
162
-
163
-
164
-
165
-
166
-
167
-
168
-
169
-
170
-
171
-
172
-
173
-
174
-
175
-
176
-
177
-
178
-
179
-
180
-
181
-
182
-
183
-
184
-
185
-
186
-
187
-
188
-
189
-
190
-
191
-
192
-
193
-
194
-
195
-
196
-
197
-
198
-
199
-
200
-
201
-
202
-
203
-
204
-
205
-
206
-
207
-
208
-
209
-
210
-
211
-
212
-
213
-
214
-
215
-
216
-
217
-
218
-
219
-
220
-
221
-
222
-
223
-
224
-
225
-
226
-
227
-
228
-
229
-
230
-
231
-
232
-
233
-
234
-
235
-
236
-
237
-
238
-
239
-
240
-
241
-
242
-
243
-
244
-
245
-
246
-
247
-
248
-
249
-
250
-
251
-
252
-
253
-
254
-
255
-
256
-
257
-
258
-
259
-
260
-
261
-
262
-
263
-
264
-
265
-
266
-
267
-
268
-
269
-
270
-
271
-
272
-
273
-
274
-
275
-
276
-
277
-
278
-
279
-
280
-
281
-
282
-
283
-
284
-
285
-
286
-
287
-
288
-
289
-
290
-
291
-
292
-
293
-
294
-
295
-
296
-
297
-
298
-
299
-
300
-
301
-
302
-
303
-
304
-
305
-
306
-
307
-
308
-
309
-
310
-
311
-
312
-
313
-
314
-
315
-
316
-
317
-
318
-
319
-
320
-
321
-
322
-
323
-
324
-
325
-
326
-
327
-
328
-
329
-
330
-
331
-
332
-
333
 |
 |

Table of Contents
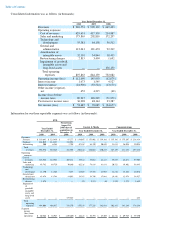
percentage of consolidated revenues decreased to 19.1% for the year ended December 31, 2010, compared to 20.5% for the prior-year period.
The decrease of $26.9 million was due to a $19.3 million decrease in sales and marketing expenses associated with our Communications
segment and a $12.6 million decrease in sales and marketing expenses associated with our Content & Media segment. These decreases were
partially offset by a $4.1 million increase in sales and marketing expenses associated with our FTD segment and a $0.3 million increase in
depreciation expense. Sales and marketing expenses related to our FTD, Content & Media and Communications segments constituted 53.1%,
35.2% and 11.6%, respectively, of total segment sales and marketing expenses for the year ended December 31, 2010, compared to 43.9%,
36.6% and 19.5%, respectively, for the year ended December 31, 2009.
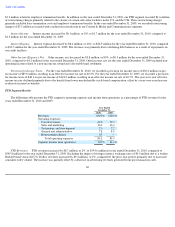
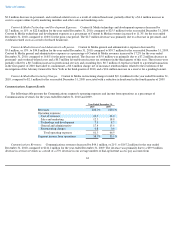
Technology and Development Expenses. Consolidated technology and development expenses decreased by $8.8 million, or 14%, to
$55.4 million for the year ended December 31, 2010, compared to $64.2 million for the year ended December 31, 2009. Consolidated technology
and development expenses as a percentage of consolidated revenues decreased to 6.0% for the year ended December 31, 2010, compared to
6.5% for the prior-year period. The decrease of $8.8 million was primarily related to a $6.2 million decrease in technology and development
expenses associated with our Communications segment, a $2.7 million decrease in technology and development expenses associated with our
Content & Media segment and a $0.7 million decrease in technology and development expenses associated with our FTD segment. These
decreases were partially offset by a $0.8 million increase in depreciation expense. Technology and development expenses related to our FTD,
Content & Media and Communications segments constituted 24.2%, 49.3% and 26.5%, respectively, of total segment technology and
development expenses for the year ended December 31, 2010, compared to 21.2%, 45.7% and 33.1%, respectively, for the year ended
December 31, 2009.
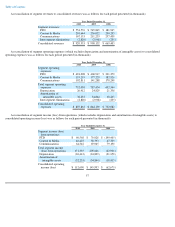
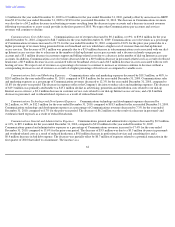
General and Administrative Expenses. Consolidated general and administrative expenses decreased by $9.4 million, or 8%, to
$112.0 million for the year ended December 31, 2010, compared to $121.5 million for the year ended December 31, 2009. Consolidated general
and administrative expenses as a percentage of consolidated revenues decreased slightly to 12.2% for the year ended December 31, 2010,
compared to 12.3% for the prior-year period. The decrease of $9.4 million was primarily due to a $5.0 million decrease in general and
administrative expenses associated with our Content & Media segment, a $3.9 million decrease in general and administrative expenses
associated with our Communications segment, a $0.3 million decrease in general and administrative expenses associated with our FTD segment,
and a $0.3 million decrease in depreciation expense. Consolidated general and administrative expenses for the year ended December 31, 2010
included $2.0 million of expenses incurred in the first quarter of the year in connection with a potential transaction that failed to consummate.
Such expenses were allocated to the FTD, Content & Media and Communications segments equally and are reflected in the aforementioned
financial results. General and administrative expenses related to our FTD, Content & Media and Communications segments constituted 40.5%,
32.4% and 27.1%, respectively, of total segment general and administrative expenses for the year ended December 31, 2010, compared to
37.6%, 34.1% and 28.3%, respectively, for the year ended December 31, 2009.
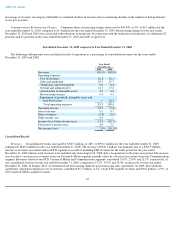
Amortization of Intangible Assets. Consolidated amortization of intangible assets decreased by $2.7 million, or 8%, to $32.1 million for
the year ended December 31, 2010, compared to $34.8 million for the year ended December 31, 2009. The decrease was primarily due to certain
intangible assets related to our acquisition of Classmates Online, Inc. and its subsidiaries in 2004 becoming fully amortized in 2009 and 2010.
Restructuring Charges. Consolidated restructuring charges decreased by $0.7 million, or 19%, to $2.8 million for the year ended
December 31, 2010, compared to $3.5 million for the year ended December 31, 2009. In December 2010, our Communications segment
recorded restructuring charges of
59