Classmates.com 2010 Annual Report Download - page 72
Download and view the complete annual report
Please find page 72 of the 2010 Classmates.com annual report below. You can navigate through the pages in the report by either clicking on the pages listed below, or by using the keyword search tool below to find specific information within the annual report.-
 1
1 -
2
-
3
-
4
-
5
-
6
-
7
-
8
-
9
-
10
-
11
-
12
-
13
-
14
-
15
-
16
-
17
-
18
-
19
-
20
-
21
-
22
-
23
-
24
-
25
-
26
-
27
-
28
-
29
-
30
-
31
-
32
-
33
-
34
-
35
-
36
-
37
-
38
-
39
-
40
-
41
-
42
-
43
-
44
-
45
-
46
-
47
-
48
-
49
-
50
-
51
-
52
-
53
-
54
-
55
-
56
-
57
-
58
-
59
-
60
-
61
-
 62
62 -
 63
63 -
 64
64 -
 65
65 -
 66
66 -
 67
67 -
 68
68 -
 69
69 -
 70
70 -
 71
71 -
 72
72 -
 73
73 -
 74
74 -
 75
75 -
 76
76 -
 77
77 -
 78
78 -
 79
79 -
 80
80 -
 81
81 -
 82
82 -
83
-
84
-
85
-
86
-
87
-
88
-
89
-
90
-
91
-
92
-
93
-
94
-
95
-
96
-
97
-
98
-
99
-
100
-
101
-
102
-
103
-
104
-
105
-
106
-
107
-
108
-
109
-
110
-
111
-
112
-
113
-
114
-
115
-
116
-
117
-
118
-
119
-
120
-
121
-
122
-
123
-
124
-
125
-
126
-
127
-
128
-
129
-
130
-
131
-
132
-
133
-
134
-
135
-
136
-
137
-
138
-
139
-
140
-
141
-
142
-
143
-
144
-
145
-
146
-
147
-
148
-
149
-
150
-
151
-
152
-
153
-
154
-
155
-
156
-
157
-
158
-
159
-
160
-
161
-
162
-
163
-
164
-
165
-
166
-
167
-
168
-
169
-
170
-
171
-
172
-
173
-
174
-
175
-
176
-
177
-
178
-
179
-
180
-
181
-
182
-
183
-
184
-
185
-
186
-
187
-
188
-
189
-
190
-
191
-
192
-
193
-
194
-
195
-
196
-
197
-
198
-
199
-
200
-
201
-
202
-
203
-
204
-
205
-
206
-
207
-
208
-
209
-
210
-
211
-
212
-
213
-
214
-
215
-
216
-
217
-
218
-
219
-
220
-
221
-
222
-
223
-
224
-
225
-
226
-
227
-
228
-
229
-
230
-
231
-
232
-
233
-
234
-
235
-
236
-
237
-
238
-
239
-
240
-
241
-
242
-
243
-
244
-
245
-
246
-
247
-
248
-
249
-
250
-
251
-
252
-
253
-
254
-
255
-
256
-
257
-
258
-
259
-
260
-
261
-
262
-
263
-
264
-
265
-
266
-
267
-
268
-
269
-
270
-
271
-
272
-
273
-
274
-
275
-
276
-
277
-
278
-
279
-
280
-
281
-
282
-
283
-
284
-
285
-
286
-
287
-
288
-
289
-
290
-
291
-
292
-
293
-
294
-
295
-
296
-
297
-
298
-
299
-
300
-
301
-
302
-
303
-
304
-
305
-
306
-
307
-
308
-
309
-
310
-
311
-
312
-
313
-
314
-
315
-
316
-
317
-
318
-
319
-
320
-
321
-
322
-
323
-
324
-
325
-
326
-
327
-
328
-
329
-
330
-
331
-
332
-
333
 |
 |

Table of Contents
reclassifications to conform with the Company's financial statement presentation. Historical public filings of FTD Group, Inc. are available at the
SEC's website at www.sec.gov .
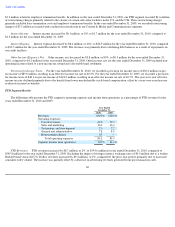
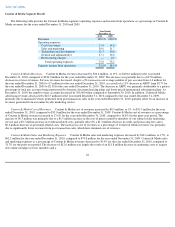
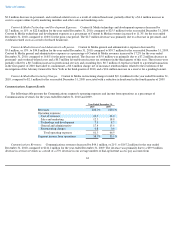
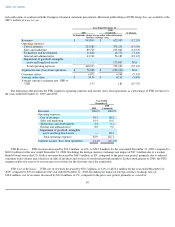
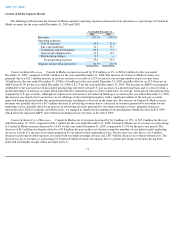
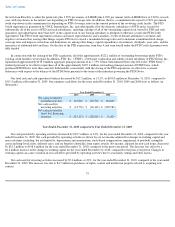
The following table presents the FTD segment's operating expenses and income (loss) from operations as a percentage of FTD revenues for
the years ended December 31, 2009 and 2008.
FTD Revenues.
FTD revenues decreased by $76.2 million, or 12%, to $545.8 million for the year ended December 31, 2009, compared to
$622.0 million for the year ended December 31, 2008. Excluding the foreign currency exchange rate impact of $27.3 million due to a weaker
British Pound versus the U.S. Dollar, revenues decreased by $48.9 million, or 8%, compared to the prior-year period, primarily due to reduced
consumer order volume and a decrease in sales of products and services to our floral network members. In the fourth quarter of 2009, the FTD
segment achieved a year-over-year increase in revenues for the first time since the acquisition.
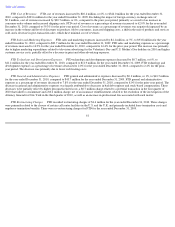
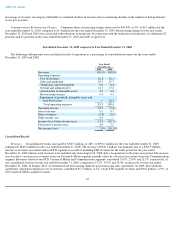
FTD Cost of Revenues. FTD cost of revenues decreased by $50.7 million, or 14%, to $323.6 million for the year ended December 31,
2009, compared to $374.2 million for the year ended December 31, 2008. Excluding the impact of foreign currency exchange rates of
$18.8 million, cost of revenues decreased by $31.8 million, or 9%, compared to the prior-year period, primarily as a result of
69
Year Ended December 31,
2009 2008
(Combined) % Change
(in thousands, except average order value and average
currency exchange rates)
Revenues
$
545,845
$
622,003
(12.2
)%
Operating expenses:
Cost of revenues
323,581
374,231
(13.5
)%
Sales and marketing
89,720
103,046
(12.9
)%
Technology and development
11,868
12,770
(7.1
)%
General and administrative
43,748
56,189
(22.1
)%
Impairment of goodwill, intangible
assets and long
-
lived assets
—
175,867
N/A
Total operating expenses
468,917
722,103
(35.1
)%
Segment income (loss) from operations
$
76,928
$
(100,100
)
N/A
Consumer orders
6,071
6,548
(7.3
)%
Average order value
$
59.56
$
62.99
(5.4
)%
Average currency exchange rate: GBP to
USD
1.55
1.86
(16.7
)%
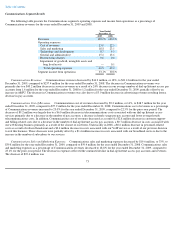
Year Ended
December 31,
2009
2008
(Combined)
Revenues
100.0
%
100.0
%
Operating expenses:
Cost of revenues
59.3
60.2
Sales and marketing
16.4
16.6
Technology and development
2.2
2.1
General and administrative
8.0
9.0
Impairment of goodwill, intangible
assets and long
-
lived assets
—
28.3
Total operating expenses
85.9
116.1
Segment income (loss) from operations
14.1
%
(16.1
)%