Classmates.com 2010 Annual Report Download - page 52
Download and view the complete annual report
Please find page 52 of the 2010 Classmates.com annual report below. You can navigate through the pages in the report by either clicking on the pages listed below, or by using the keyword search tool below to find specific information within the annual report.-
 1
1 -
2
-
3
-
4
-
5
-
6
-
7
-
8
-
9
-
10
-
11
-
12
-
13
-
14
-
15
-
16
-
17
-
18
-
19
-
20
-
21
-
22
-
23
-
24
-
25
-
26
-
27
-
28
-
29
-
30
-
31
-
32
-
33
-
34
-
35
-
36
-
37
-
38
-
39
-
40
-
41
-
 42
42 -
 43
43 -
 44
44 -
 45
45 -
 46
46 -
 47
47 -
 48
48 -
 49
49 -
 50
50 -
 51
51 -
 52
52 -
 53
53 -
 54
54 -
 55
55 -
 56
56 -
 57
57 -
 58
58 -
 59
59 -
 60
60 -
 61
61 -
 62
62 -
63
-
64
-
65
-
66
-
67
-
68
-
69
-
70
-
71
-
72
-
73
-
74
-
75
-
76
-
77
-
78
-
79
-
80
-
81
-
82
-
83
-
84
-
85
-
86
-
87
-
88
-
89
-
90
-
91
-
92
-
93
-
94
-
95
-
96
-
97
-
98
-
99
-
100
-
101
-
102
-
103
-
104
-
105
-
106
-
107
-
108
-
109
-
110
-
111
-
112
-
113
-
114
-
115
-
116
-
117
-
118
-
119
-
120
-
121
-
122
-
123
-
124
-
125
-
126
-
127
-
128
-
129
-
130
-
131
-
132
-
133
-
134
-
135
-
136
-
137
-
138
-
139
-
140
-
141
-
142
-
143
-
144
-
145
-
146
-
147
-
148
-
149
-
150
-
151
-
152
-
153
-
154
-
155
-
156
-
157
-
158
-
159
-
160
-
161
-
162
-
163
-
164
-
165
-
166
-
167
-
168
-
169
-
170
-
171
-
172
-
173
-
174
-
175
-
176
-
177
-
178
-
179
-
180
-
181
-
182
-
183
-
184
-
185
-
186
-
187
-
188
-
189
-
190
-
191
-
192
-
193
-
194
-
195
-
196
-
197
-
198
-
199
-
200
-
201
-
202
-
203
-
204
-
205
-
206
-
207
-
208
-
209
-
210
-
211
-
212
-
213
-
214
-
215
-
216
-
217
-
218
-
219
-
220
-
221
-
222
-
223
-
224
-
225
-
226
-
227
-
228
-
229
-
230
-
231
-
232
-
233
-
234
-
235
-
236
-
237
-
238
-
239
-
240
-
241
-
242
-
243
-
244
-
245
-
246
-
247
-
248
-
249
-
250
-
251
-
252
-
253
-
254
-
255
-
256
-
257
-
258
-
259
-
260
-
261
-
262
-
263
-
264
-
265
-
266
-
267
-
268
-
269
-
270
-
271
-
272
-
273
-
274
-
275
-
276
-
277
-
278
-
279
-
280
-
281
-
282
-
283
-
284
-
285
-
286
-
287
-
288
-
289
-
290
-
291
-
292
-
293
-
294
-
295
-
296
-
297
-
298
-
299
-
300
-
301
-
302
-
303
-
304
-
305
-
306
-
307
-
308
-
309
-
310
-
311
-
312
-
313
-
314
-
315
-
316
-
317
-
318
-
319
-
320
-
321
-
322
-
323
-
324
-
325
-
326
-
327
-
328
-
329
-
330
-
331
-
332
-
333
 |
 |

Table of Contents
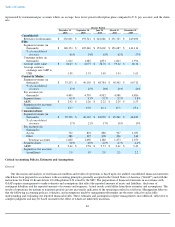
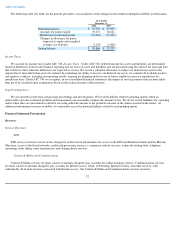
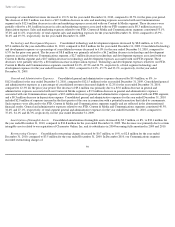
We performed step one of our annual goodwill impairment test in the fourth quarter of 2010 and determined that the fair value of our FTD,
Interflora, Classmates Online, MyPoints, and Communications reporting units exceeded their net book values, including goodwill. Accordingly,
step two was not required.
The determination of whether or not goodwill is impaired involves a significant level of judgment in the assumptions underlying the
approaches used to determine the estimated fair value of our reporting units. Our analysis included sufficient tolerance for sensitivity in key
assumptions. The determination of the fair value of our reporting units included a study of market comparables, including the selection of
appropriate valuation multiples and discounted cash flow models based on our internal forecasts and projections.
The estimated fair values for our FTD, Interflora and MyPoints reporting units were determined using a combination of the income
approach and the market approach. The estimated fair values of our Classmates Online and Communications reporting units were determined
using the income approach. Under the income approach, a reporting unit's fair value is estimated based on the discounted cash flow method. The
discounted cash flow method is dependent upon a number of factors, including projections of the amounts and timing of future revenues and
cash flows, assumed discount rates and other assumptions. Under the market approach, using the guideline company method, a reporting unit's
fair value is estimated based on multiples of the cash-free market value of invested capital to revenue and adjusted EBITDA of the guideline
companies. Adjusted EBITDA amounts excluded stock-based compensation expense for the reporting units and guideline companies. The
revenue and adjusted EBITDA multiples of our reporting units were selected based on a comparison of each reporting unit's operating
performance and margins, among other factors, to those of the guideline companies.
Based on our impairment testing in the fourth quarter of 2010, an increase or decrease of 100 basis points in the discount rate or the
terminal growth rate for each of our reporting units would not have resulted in any goodwill impairment. We believe the assumptions and rates
used in our impairment assessment are reasonable, but they are judgmental, and variations in any assumptions could result in a materially
different calculation of the impairment amount, if any.
Intangible Assets and Other Long
-Lived Assets
We account for identifiable intangible assets and other long-lived assets in accordance with ASC 360, Property, Plant and Equipment ,
which addresses financial accounting and reporting for the impairment and disposition of identifiable intangible assets and other long-lived
assets. Intangible assets acquired in a business combination are initially recorded at management's estimate of their fair values. We evaluate the
recoverability of identifiable intangible assets and other long-lived assets for impairment when events occur or circumstances change that would
indicate that the carrying amount of an asset may not be recoverable. Events or circumstances that may indicate that an asset is impaired include,
but are not limited to, significant decreases in the market value of an asset, significant underperformance relative to expected historical or
projected future operating results, a change in the extent or manner in which an asset is used, shifts in technology, loss of key management or
other personnel, significant negative industry or economic trends, changes in our operating model or strategy, and competitive forces. In
determining if an impairment exists, we estimate the undiscounted cash flows to be generated from the use and ultimate disposition of these
assets. If an impairment is indicated based on a comparison of the assets' carrying values and the undiscounted cash flows, the impairment loss is
measured as the amount by which the carrying amount of the assets exceeds the fair market value of the assets. Definite-lived intangible assets
are amortized on either a straight-line basis or an accelerated basis over their estimated useful lives, ranging from two to ten years. Our
identifiable intangible assets were acquired primarily in connection with business combinations. We did not record any impairment charges
related to our intangible assets in the year ended December 31, 2010.
50