Classmates.com 2010 Annual Report Download - page 70
Download and view the complete annual report
Please find page 70 of the 2010 Classmates.com annual report below. You can navigate through the pages in the report by either clicking on the pages listed below, or by using the keyword search tool below to find specific information within the annual report.-
 1
1 -
2
-
3
-
4
-
5
-
6
-
7
-
8
-
9
-
10
-
11
-
12
-
13
-
14
-
15
-
16
-
17
-
18
-
19
-
20
-
21
-
22
-
23
-
24
-
25
-
26
-
27
-
28
-
29
-
30
-
31
-
32
-
33
-
34
-
35
-
36
-
37
-
38
-
39
-
40
-
41
-
42
-
43
-
44
-
45
-
46
-
47
-
48
-
49
-
50
-
51
-
52
-
53
-
54
-
55
-
56
-
57
-
58
-
59
-
 60
60 -
 61
61 -
 62
62 -
 63
63 -
 64
64 -
 65
65 -
 66
66 -
 67
67 -
 68
68 -
 69
69 -
 70
70 -
 71
71 -
 72
72 -
 73
73 -
 74
74 -
 75
75 -
 76
76 -
 77
77 -
 78
78 -
 79
79 -
 80
80 -
81
-
82
-
83
-
84
-
85
-
86
-
87
-
88
-
89
-
90
-
91
-
92
-
93
-
94
-
95
-
96
-
97
-
98
-
99
-
100
-
101
-
102
-
103
-
104
-
105
-
106
-
107
-
108
-
109
-
110
-
111
-
112
-
113
-
114
-
115
-
116
-
117
-
118
-
119
-
120
-
121
-
122
-
123
-
124
-
125
-
126
-
127
-
128
-
129
-
130
-
131
-
132
-
133
-
134
-
135
-
136
-
137
-
138
-
139
-
140
-
141
-
142
-
143
-
144
-
145
-
146
-
147
-
148
-
149
-
150
-
151
-
152
-
153
-
154
-
155
-
156
-
157
-
158
-
159
-
160
-
161
-
162
-
163
-
164
-
165
-
166
-
167
-
168
-
169
-
170
-
171
-
172
-
173
-
174
-
175
-
176
-
177
-
178
-
179
-
180
-
181
-
182
-
183
-
184
-
185
-
186
-
187
-
188
-
189
-
190
-
191
-
192
-
193
-
194
-
195
-
196
-
197
-
198
-
199
-
200
-
201
-
202
-
203
-
204
-
205
-
206
-
207
-
208
-
209
-
210
-
211
-
212
-
213
-
214
-
215
-
216
-
217
-
218
-
219
-
220
-
221
-
222
-
223
-
224
-
225
-
226
-
227
-
228
-
229
-
230
-
231
-
232
-
233
-
234
-
235
-
236
-
237
-
238
-
239
-
240
-
241
-
242
-
243
-
244
-
245
-
246
-
247
-
248
-
249
-
250
-
251
-
252
-
253
-
254
-
255
-
256
-
257
-
258
-
259
-
260
-
261
-
262
-
263
-
264
-
265
-
266
-
267
-
268
-
269
-
270
-
271
-
272
-
273
-
274
-
275
-
276
-
277
-
278
-
279
-
280
-
281
-
282
-
283
-
284
-
285
-
286
-
287
-
288
-
289
-
290
-
291
-
292
-
293
-
294
-
295
-
296
-
297
-
298
-
299
-
300
-
301
-
302
-
303
-
304
-
305
-
306
-
307
-
308
-
309
-
310
-
311
-
312
-
313
-
314
-
315
-
316
-
317
-
318
-
319
-
320
-
321
-
322
-
323
-
324
-
325
-
326
-
327
-
328
-
329
-
330
-
331
-
332
-
333
 |
 |

Table of Contents
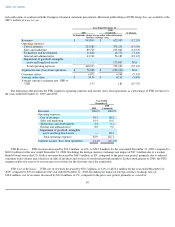
December 31, 2009, compared to 7.4%, 44.2% and 48.4%, respectively, for the year ended December 31, 2008.
General and Administrative Expenses. Consolidated general and administrative expenses increased by $29.3 million, or 32%, to
$121.5 million, for the year ended December 31, 2009, compared to $92.2 million for the year ended December 31, 2008. The increase of
$29.3 million was primarily due to a $29.7 million increase in general and administrative expenses associated with our FTD segment as a result
of including FTD general and administrative expenses for the entire period in the year ended December 31, 2009 whereas such expenses were
included only from August 26, 2008 (date of acquisition) in the prior-
year period and, to a lesser extent, an increase in general and administrative
expenses associated with our Content & Media segment. The increase was partially offset by a decrease in general and administrative expenses
associated with our Communications segment. Consolidated general and administrative expenses as a percentage of consolidated revenues
decreased to 12.3% for the year ended December 31, 2009, compared to 13.8% for the prior-year period primarily as a result of including FTD
for the entire period for the year ended December 31, 2009 since our FTD segment has lower general and administrative expenses as a
percentage of its revenues compared to the other segments. General and administrative expenses related to our FTD, Content & Media and
Communications segments constituted 37.6%, 34.1% and 28.3%, respectively, of total segment general and administrative expenses for the year
ended December 31, 2009, compared to 16.2%, 43.7% and 40.2%, respectively, for the year ended December 31, 2008.
Amortization of Intangible Assets.
Consolidated amortization of intangible assets increased by $16.4 million, or 89%, to $34.8 million for
the year ended December 31, 2009, compared to $18.4 million for the year ended December 31, 2008. The increase was primarily due to an
increase in amortization of intangible assets associated with our FTD segment as a result of including FTD amortization of intangible assets for
the entire period for the year ended December 31, 2009 whereas such expenses were included only from August 26, 2008 (date of acquisition) in
the prior-year period.
Restructuring Charges. Consolidated restructuring charges increased by $1.8 million, or 107%, to $3.5 million for the year ended
December 31, 2009, compared to $1.7 million for the year ended December 31, 2008. Restructuring charges for the year ended December 31,
2009 were primarily associated with a reduction in headcount in the fourth quarter in our Content & Media and Communications segments. We
eliminated 71 positions within our Content & Media segment, and 25 positions within our Communications segment. Restructuring charges for
the year ended December 31, 2008 were primarily associated with the closure of our Orem, Utah facility and a reduction in headcount in our
Communications segment.
Impairment of Goodwill, Intangible Assets and Long-Lived Assets. There were no impairment charges for the year ended December 31,
2009, compared to $176.2 million for the year ended December 31, 2008. Impairment charges for the year ended December 31, 2008 were
primarily due to a reduction in the fair value of the FTD reporting unit compared to its carrying value and lower fair values in the FTD and
Interflora trademarks and trade names compared to their carrying values.
Interest Income. Interest income decreased by $3.0 million, or 66%, to $1.5 million for the year ended December 31, 2009, compared to
$4.5 million for the year ended December 31, 2008. The decrease in interest income was primarily due to the liquidation of our short-term
investments portfolio to partially fund the FTD acquisition in August 2008, as well as to a decline in interest rates as a result of the interest rate
environment in recent quarterly periods and to our decision in the fourth quarter of 2008 to invest in only cash and cash equivalents. The
decrease in interest income was partially offset by higher average cash and cash equivalents balances for the year ended December 31, 2009,
compared to the prior-year period.
67