Classmates.com 2010 Annual Report Download - page 48
Download and view the complete annual report
Please find page 48 of the 2010 Classmates.com annual report below. You can navigate through the pages in the report by either clicking on the pages listed below, or by using the keyword search tool below to find specific information within the annual report.-
 1
1 -
2
-
3
-
4
-
5
-
6
-
7
-
8
-
9
-
10
-
11
-
12
-
13
-
14
-
15
-
16
-
17
-
18
-
19
-
20
-
21
-
22
-
23
-
24
-
25
-
26
-
27
-
28
-
29
-
30
-
31
-
32
-
33
-
34
-
35
-
36
-
37
-
 38
38 -
 39
39 -
 40
40 -
 41
41 -
 42
42 -
 43
43 -
 44
44 -
 45
45 -
 46
46 -
 47
47 -
 48
48 -
 49
49 -
 50
50 -
 51
51 -
 52
52 -
 53
53 -
 54
54 -
 55
55 -
 56
56 -
 57
57 -
 58
58 -
59
-
60
-
61
-
62
-
63
-
64
-
65
-
66
-
67
-
68
-
69
-
70
-
71
-
72
-
73
-
74
-
75
-
76
-
77
-
78
-
79
-
80
-
81
-
82
-
83
-
84
-
85
-
86
-
87
-
88
-
89
-
90
-
91
-
92
-
93
-
94
-
95
-
96
-
97
-
98
-
99
-
100
-
101
-
102
-
103
-
104
-
105
-
106
-
107
-
108
-
109
-
110
-
111
-
112
-
113
-
114
-
115
-
116
-
117
-
118
-
119
-
120
-
121
-
122
-
123
-
124
-
125
-
126
-
127
-
128
-
129
-
130
-
131
-
132
-
133
-
134
-
135
-
136
-
137
-
138
-
139
-
140
-
141
-
142
-
143
-
144
-
145
-
146
-
147
-
148
-
149
-
150
-
151
-
152
-
153
-
154
-
155
-
156
-
157
-
158
-
159
-
160
-
161
-
162
-
163
-
164
-
165
-
166
-
167
-
168
-
169
-
170
-
171
-
172
-
173
-
174
-
175
-
176
-
177
-
178
-
179
-
180
-
181
-
182
-
183
-
184
-
185
-
186
-
187
-
188
-
189
-
190
-
191
-
192
-
193
-
194
-
195
-
196
-
197
-
198
-
199
-
200
-
201
-
202
-
203
-
204
-
205
-
206
-
207
-
208
-
209
-
210
-
211
-
212
-
213
-
214
-
215
-
216
-
217
-
218
-
219
-
220
-
221
-
222
-
223
-
224
-
225
-
226
-
227
-
228
-
229
-
230
-
231
-
232
-
233
-
234
-
235
-
236
-
237
-
238
-
239
-
240
-
241
-
242
-
243
-
244
-
245
-
246
-
247
-
248
-
249
-
250
-
251
-
252
-
253
-
254
-
255
-
256
-
257
-
258
-
259
-
260
-
261
-
262
-
263
-
264
-
265
-
266
-
267
-
268
-
269
-
270
-
271
-
272
-
273
-
274
-
275
-
276
-
277
-
278
-
279
-
280
-
281
-
282
-
283
-
284
-
285
-
286
-
287
-
288
-
289
-
290
-
291
-
292
-
293
-
294
-
295
-
296
-
297
-
298
-
299
-
300
-
301
-
302
-
303
-
304
-
305
-
306
-
307
-
308
-
309
-
310
-
311
-
312
-
313
-
314
-
315
-
316
-
317
-
318
-
319
-
320
-
321
-
322
-
323
-
324
-
325
-
326
-
327
-
328
-
329
-
330
-
331
-
332
-
333
 |
 |

Table of Contents
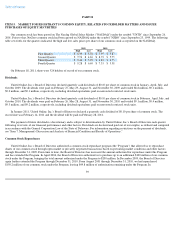
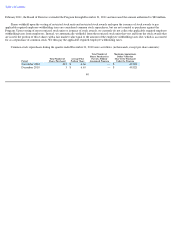
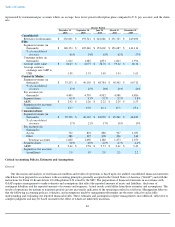
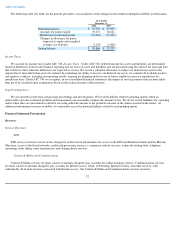
represented by international pay accounts which, on average, have lower-
priced subscription plans compared to U.S. pay accounts, and the churn
rate.
Critical Accounting Policies, Estimates and Assumptions
General
Our discussion and analysis of our financial condition and results of operations is based upon our audited consolidated financial statements,
which have been prepared in accordance with accounting principles generally accepted in the United States of America ("GAAP") and with the
instructions for Form 10-K and Article 10 of Regulation S-X issued by the SEC. The preparation of financial statements in accordance with
GAAP requires management to make estimates and assumptions that affect the reported amounts of assets and liabilities, disclosure of
contingent liabilities and the reported amounts of revenues and expenses. Actual results could differ from those estimates and assumptions. The
results of operations for interim or transition periods are not necessarily indicative of the operating results for a full year. Management believes
that the following accounting policies, estimates, and assumptions made by management thereunder are the most critical to aid in fully
understanding and evaluating our reported financial results. These estimates and assumptions require management's most difficult, subjective or
complex judgment and may be based on matters the effect of which are inherently uncertain.
46
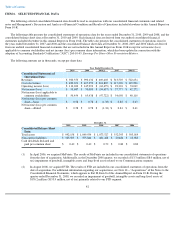
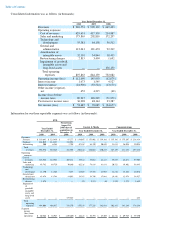
Quarter Ended
December 31,
2010 September 30,
2010 June 30,
2010 March 31,
2010 December 31,
2009
Consolidated:
Revenues (in thousands)
$
232,601
$
193,541
$
242,686
$
251,725
$
249,490
FTD:
Segment revenues (in
thousands)
$
140,174
$
105,046
$
152,669
$
156,687
$
141,116
% of consolidated
revenues
60
%
54
%
63
%
62
%
57
%
Consumer orders (in
thousands)
1,612
1,085
1,851
1,813
1,594
Average order value
$
60.43
$
60.77
$
58.76
$
59.42
$
60.14
Average currency
exchange rate: GBP to
USD
1.58
1.55
1.49
1.54
1.63
Content & Media:
Segment revenues (in
thousands)
$
53,253
$
49,105
$
48,784
$
50,502
$
60,712
% of consolidated
revenues
23
%
25
%
20
%
20
%
24
%
Pay accounts (in
thousands)
4,499
4,795
4,982
4,988
4,886
Segment churn
4.1
%
3.5
%
3.1
%
3.2
%
3.8
%
ARPU
$
2.42
$
2.26
$
2.22
$
2.29
$
2.53
Segment active accounts
(in millions)
13.7
15.0
16.1
17.5
19.4
Communications:
Segment revenues (in
thousands)
$
39,708
$
40,165
$
42,039
$
45,241
$
48,429
% of consolidated
revenues
17
%
21
%
17
%
18
%
19
%
Pay accounts (in
thousands):
Access
732
801
880
967
1,036
Other
288
295
300
306
314
Total pay accounts
1,020
1,096
1,180
1,273
1,350
Segment churn
3.8
%
4.0
%
4.2
%
4.3
%
4.4
%
ARPU
$
9.46
$
9.58
$
9.57
$
9.41
$
9.43
Segment active accounts
(in millions)
1.8
1.9
2.0
2.1
2.2