Classmates.com 2010 Annual Report Download - page 68
Download and view the complete annual report
Please find page 68 of the 2010 Classmates.com annual report below. You can navigate through the pages in the report by either clicking on the pages listed below, or by using the keyword search tool below to find specific information within the annual report.-
 1
1 -
2
-
3
-
4
-
5
-
6
-
7
-
8
-
9
-
10
-
11
-
12
-
13
-
14
-
15
-
16
-
17
-
18
-
19
-
20
-
21
-
22
-
23
-
24
-
25
-
26
-
27
-
28
-
29
-
30
-
31
-
32
-
33
-
34
-
35
-
36
-
37
-
38
-
39
-
40
-
41
-
42
-
43
-
44
-
45
-
46
-
47
-
48
-
49
-
50
-
51
-
52
-
53
-
54
-
55
-
56
-
57
-
 58
58 -
 59
59 -
 60
60 -
 61
61 -
 62
62 -
 63
63 -
 64
64 -
 65
65 -
 66
66 -
 67
67 -
 68
68 -
 69
69 -
 70
70 -
 71
71 -
 72
72 -
 73
73 -
 74
74 -
 75
75 -
 76
76 -
 77
77 -
 78
78 -
79
-
80
-
81
-
82
-
83
-
84
-
85
-
86
-
87
-
88
-
89
-
90
-
91
-
92
-
93
-
94
-
95
-
96
-
97
-
98
-
99
-
100
-
101
-
102
-
103
-
104
-
105
-
106
-
107
-
108
-
109
-
110
-
111
-
112
-
113
-
114
-
115
-
116
-
117
-
118
-
119
-
120
-
121
-
122
-
123
-
124
-
125
-
126
-
127
-
128
-
129
-
130
-
131
-
132
-
133
-
134
-
135
-
136
-
137
-
138
-
139
-
140
-
141
-
142
-
143
-
144
-
145
-
146
-
147
-
148
-
149
-
150
-
151
-
152
-
153
-
154
-
155
-
156
-
157
-
158
-
159
-
160
-
161
-
162
-
163
-
164
-
165
-
166
-
167
-
168
-
169
-
170
-
171
-
172
-
173
-
174
-
175
-
176
-
177
-
178
-
179
-
180
-
181
-
182
-
183
-
184
-
185
-
186
-
187
-
188
-
189
-
190
-
191
-
192
-
193
-
194
-
195
-
196
-
197
-
198
-
199
-
200
-
201
-
202
-
203
-
204
-
205
-
206
-
207
-
208
-
209
-
210
-
211
-
212
-
213
-
214
-
215
-
216
-
217
-
218
-
219
-
220
-
221
-
222
-
223
-
224
-
225
-
226
-
227
-
228
-
229
-
230
-
231
-
232
-
233
-
234
-
235
-
236
-
237
-
238
-
239
-
240
-
241
-
242
-
243
-
244
-
245
-
246
-
247
-
248
-
249
-
250
-
251
-
252
-
253
-
254
-
255
-
256
-
257
-
258
-
259
-
260
-
261
-
262
-
263
-
264
-
265
-
266
-
267
-
268
-
269
-
270
-
271
-
272
-
273
-
274
-
275
-
276
-
277
-
278
-
279
-
280
-
281
-
282
-
283
-
284
-
285
-
286
-
287
-
288
-
289
-
290
-
291
-
292
-
293
-
294
-
295
-
296
-
297
-
298
-
299
-
300
-
301
-
302
-
303
-
304
-
305
-
306
-
307
-
308
-
309
-
310
-
311
-
312
-
313
-
314
-
315
-
316
-
317
-
318
-
319
-
320
-
321
-
322
-
323
-
324
-
325
-
326
-
327
-
328
-
329
-
330
-
331
-
332
-
333
 |
 |

Table of Contents
percentage of revenues was largely attributable to continued declines in revenues due to continuing declines in the number of dial-up Internet
access pay accounts.
Communications Restructuring Charges. Communications restructuring charges decreased by $41,000, or 3%, to $1.3 million for the
year ended December 31, 2010, compared to $1.4 million for the year ended December 31, 2009. Restructuring charges for the year ended
December 31, 2010 and 2009 were associated with reductions in headcount. In connection with the reductions in headcount, we eliminated 22
positions and 25 positions in the years ended December 31, 2010 and 2009, respectively.
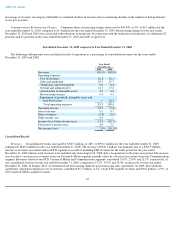
Year Ended December 31, 2009 compared to Year Ended December 31, 2008
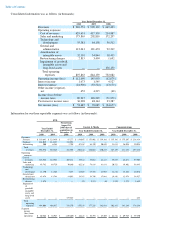
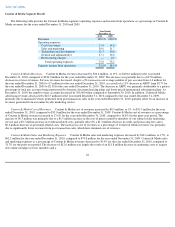
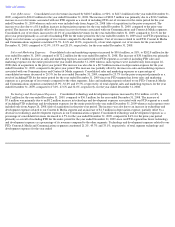
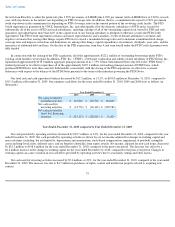
The following table presents our consolidated results of operations as a percentage of consolidated revenues for the years ended
December 31, 2009 and 2008.
Consolidated Results
Revenues. Consolidated revenues increased by $320.7 million, or 48%, to $990.1 million for the year ended December 31, 2009,
compared to $669.4 million for the year ended December 31, 2008. The increase of $320.7 million was primarily due to a $363.9 million
increase in revenues associated with our FTD segment as a result of including FTD revenues for the entire period for the year ended
December 31, 2009 whereas such revenues were included only from August 26, 2008 (date of acquisition) in the prior-year period. The increase
was also due to an increase in revenues from our Content & Media segment, partially offset by a decrease in revenues from our Communications
segment. Revenues related to our FTD, Content & Media and Communications segments constituted 55.0%, 23.8% and 21.3%, respectively, of
our consolidated revenues for the year ended December 31, 2009, compared to 27.2%, 34.4% and 38.4%, respectively, for the year ended
December 31, 2008. In January 2010, we terminated our then-existing domestic post-transaction sales agreements. In 2009, these domestic
agreements, which have minimal costs of revenues, contributed $5.7 million, or 1%, of our FTD segment revenues and $20.8 million, or 9%, of
our Content & Media segment revenues.
65
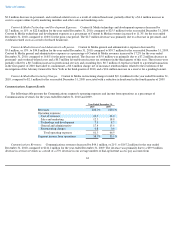
Year Ended
December 31,
2009
2008
Revenues
100.0
%
100.0
%
Operating expenses:
Cost of revenues
42.2
32.1
Sales and marketing
20.5
25.7
Technology and development
6.5
8.4
General and administrative
12.3
13.8
Amortization of intangible assets
3.5
2.8
Restructuring charges
0.4
0.3
Impairment of goodwill, intangible assets and
long
-
lived assets
—
26.3
Total operating expenses
85.3
109.4
Operating income
14.7
(9.4
)
Interest income
0.2
0.7
Interest expense
(3.4
)
(2.0
)
Other income, net
0.4
—
Income (loss) before income taxes
11.9
(10.7
)
Provision for income taxes
4.9
3.5
Net income (loss)
7.1
%
(14.1
)%