Cincinnati Bell 2011 Annual Report Download - page 74
Download and view the complete annual report
Please find page 74 of the 2011 Cincinnati Bell annual report below. You can navigate through the pages in the report by either clicking on the pages listed below, or by using the keyword search tool below to find specific information within the annual report.-
 1
1 -
2
-
3
-
4
-
5
-
6
-
7
-
8
-
9
-
10
-
11
-
12
-
13
-
14
-
15
-
16
-
17
-
18
-
19
-
20
-
21
-
22
-
23
-
24
-
25
-
26
-
27
-
28
-
29
-
30
-
31
-
32
-
33
-
34
-
35
-
36
-
37
-
38
-
39
-
40
-
41
-
42
-
43
-
44
-
45
-
46
-
47
-
48
-
49
-
50
-
51
-
52
-
53
-
54
-
55
-
56
-
57
-
58
-
59
-
60
-
61
-
62
-
63
-
 64
64 -
 65
65 -
 66
66 -
 67
67 -
 68
68 -
 69
69 -
 70
70 -
 71
71 -
 72
72 -
 73
73 -
 74
74 -
 75
75 -
 76
76 -
 77
77 -
 78
78 -
 79
79 -
 80
80 -
 81
81 -
 82
82 -
 83
83 -
 84
84 -
85
-
86
-
87
-
88
-
89
-
90
-
91
-
92
-
93
-
94
-
95
-
96
-
97
-
98
-
99
-
100
-
101
-
102
-
103
-
104
-
105
-
106
-
107
-
108
-
109
-
110
-
111
-
112
-
113
-
114
-
115
-
116
-
117
-
118
-
119
-
120
-
121
-
122
-
123
-
124
-
125
-
126
-
127
-
128
-
129
-
130
-
131
-
132
-
133
-
134
-
135
-
136
-
137
-
138
-
139
-
140
-
141
-
142
-
143
-
144
-
145
-
146
-
147
-
148
-
149
-
150
-
151
-
152
-
153
-
154
-
155
-
156
-
157
-
158
-
159
-
160
-
161
-
162
-
163
-
164
-
165
-
166
-
167
-
168
-
169
-
170
-
171
-
172
-
173
-
174
-
175
-
176
-
177
-
178
-
179
-
180
-
181
-
182
-
183
-
184
-
185
-
186
-
187
-
188
-
189
-
190
-
191
-
192
-
193
-
194
-
195
-
196
-
197
-
198
-
199
-
200
-
201
-
202
-
203
-
204
-
205
-
206
-
207
-
208
-
209
-
210
-
211
-
212
-
213
-
214
-
215
-
216
-
217
-
218
-
219
-
220
-
221
-
222
-
223
-
224
-
225
-
226
-
227
-
228
-
229
-
230
-
231
-
232
-
233
-
234
-
235
-
236
-
237
-
238
-
239
-
240
-
241
-
242
-
243
-
244
-
245
-
246
-
247
-
248
-
249
-
250
-
251
-
252
 |
 |

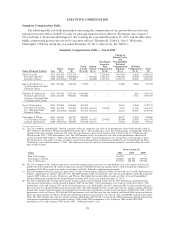
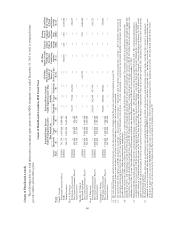
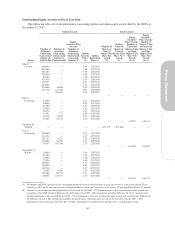
Grants of Plan-Based Awards
The following table sets forth information concerning equity grants to the NEOs during the year ended December 31, 2011 as well as estimated future
payouts under cash incentive plans:
Grant of Plan-Based Awards in 2011 Fiscal Year
Name
Grant
Date
Estimated Future Payouts
Under Non-Equity Incentive
Plan Awards (a)
Estimated Future Payouts
Under Equity Incentive Plan
Awards
All Other
Stock Awards:
Number of
Shares of
Stock or Units
(#) (b)
All Other
Option Awards:
Number of
Securities
Underlying
Options
(#) (c)
Exercise
or Base
Price of
Option
Awards
($/Sh)
Closing
Price of
Company
Shares
on Grant
Date
($/Sh)
Grant Date
Fair Value
of Stock
and Option
Awards
($) (d)
Threshold
($)
Target
($)
Maximum
($)
Threshold
(#)
Target
(#)
Maximum
(#)
John F. Cassidy
Performance-based award (e) 1/28/2011 761,250 1,015,000 5,000,000 — — — — — — — —
SARs 1/28/2011 — — — — — — — 788,656 2.85 2.85 1,015,000
Annual incentive 768,375 1,024,500 2,049,000 — — — — — — — —
Kurt A. Freyberger
Performance-based award 1/28/2011 — — — 58,125 77,500 116,250 — — — — 220,875
Data Center Performance Plan (f) 1/28/2011 435,000 870,000 870,000
Annual incentive 178,388 237,850 475,700 — — — — — — — —
Theodore H. Torbeck
Restricted stock grant 1/4/2011 — — — — — — 631,579 — — 2.85 1,800,000
Data Center Performance Plan (f) 1/28/2011 2,500,000 5,000,000 5,000,000
Annual incentive 544,500 726,000 1,452,000 — — — — — — — —
Gary J. Wojtaszek
Performance-based award 1/28/2011 — — — 226,874 302,499 453,749 — — — — 862,122
Data Center Performance Plan (f) 1/28/2011 2,000,000 4,000,000 4,000,000
Annual incentive 432,000 576,000 1,152,000 — — — — — — — —
Christopher J. Wilson
Performance-based award 1/28/2011 — — — 150,001 200,002 300,002 — — — — 570,006
Data Center Performance Plan (f) 1/28/2011 1,770,000 3,540,000 3,540,000
Annual incentive 165,750 221,000 442,000 — — — — — — — —
(a) For more detail about the annual incentive program, see the discussion in the Compensation Discussion and Analysis beginning on page 39.
(b) The restricted stock grant is a non-incentive award that vests one-third per year at the end of each one-year period.
(c) The material terms of the options and SARs granted are: grant type — non-incentive; exercise price — fair market value of common stock on grant date; vesting — 28% on the first anniversary of
the original grant date and thereafter at the rate of 3% per month for the next 24 months; term of grant — 10 years; termination — except in the case of death, disability or retirement, any unvested
awards will be cancelled 90 days following termination of employment.
(d) The amount related to the SARs awards reflects the grant-date fair values as determined using the Black-Scholes option-pricing model. The amounts related to the performance-based awards
granted for the 2011 – 2013 performance period reflect the grant-date fair value assuming the target number of shares are earned and the executive remains with the Company through the applicable
vesting dates. The amount related to the restricted share grant for Mr. Torbeck is based on the Company’s closing stock price on the date of grant of $2.85. For further discussion of assumptions and
valuation, refer to Note 14 to our Consolidated Financial Statements included in our Annual Report on Form 10-K for the year ended December 31, 2011.
(e) Represents potential amounts payable related to the cash-payment performance award for the 2011 – 2013 performance cycle that was granted in January 2011. The cash-payment performance
award provides for a target award, with the final award payment indexed to the percentage change in the Company’s stock price from the date of grant. Although the cash-payment performance
award is subject to a $5 million limit under the terms of the 2007 Long Term Incentive Plan, the maximum would only be obtained if the Company’s closing stock price on January 30, 2014 would
equal or exceed $8.60 and the maximum level of incentive payout was achieved. See the Summary Compensation Table for the amount earned in 2011 and paid in 2012 related to this award for the
2011 performance period.
(f) The Data Center Performance plan grants are performance unit awards providing for a specified cash payment to each participating executive in the event that (i) the executive is continuously
employed for a three year period after the date of grant, (ii) specified Adjusted EBITDA targets are met over such three year period, (iii) a “qualifying transaction” is consummated within ten years
of the date of grant and (iv) at least $1,000,000,000 of equity value is created in the Data Center Colocation segment prior to the “qualifying transaction.” For more detail about the Data Center
Performance Plan, see discussion in the Compensation Discussion and Analysis beginning on page 39.
60