Cincinnati Bell 2011 Annual Report Download - page 162
Download and view the complete annual report
Please find page 162 of the 2011 Cincinnati Bell annual report below. You can navigate through the pages in the report by either clicking on the pages listed below, or by using the keyword search tool below to find specific information within the annual report.-
 1
1 -
2
-
3
-
4
-
5
-
6
-
7
-
8
-
9
-
10
-
11
-
12
-
13
-
14
-
15
-
16
-
17
-
18
-
19
-
20
-
21
-
22
-
23
-
24
-
25
-
26
-
27
-
28
-
29
-
30
-
31
-
32
-
33
-
34
-
35
-
36
-
37
-
38
-
39
-
40
-
41
-
42
-
43
-
44
-
45
-
46
-
47
-
48
-
49
-
50
-
51
-
52
-
53
-
54
-
55
-
56
-
57
-
58
-
59
-
60
-
61
-
62
-
63
-
64
-
65
-
66
-
67
-
68
-
69
-
70
-
71
-
72
-
73
-
74
-
75
-
76
-
77
-
78
-
79
-
80
-
81
-
82
-
83
-
84
-
85
-
86
-
87
-
88
-
89
-
90
-
91
-
92
-
93
-
94
-
95
-
96
-
97
-
98
-
99
-
100
-
101
-
102
-
103
-
104
-
105
-
106
-
107
-
108
-
109
-
110
-
111
-
112
-
113
-
114
-
115
-
116
-
117
-
118
-
119
-
120
-
121
-
122
-
123
-
124
-
125
-
126
-
127
-
128
-
129
-
130
-
131
-
132
-
133
-
134
-
135
-
136
-
137
-
138
-
139
-
140
-
141
-
142
-
143
-
144
-
145
-
146
-
147
-
148
-
149
-
150
-
151
-
 152
152 -
 153
153 -
 154
154 -
 155
155 -
 156
156 -
 157
157 -
 158
158 -
 159
159 -
 160
160 -
 161
161 -
 162
162 -
 163
163 -
 164
164 -
 165
165 -
 166
166 -
 167
167 -
 168
168 -
 169
169 -
 170
170 -
 171
171 -
 172
172 -
173
-
174
-
175
-
176
-
177
-
178
-
179
-
180
-
181
-
182
-
183
-
184
-
185
-
186
-
187
-
188
-
189
-
190
-
191
-
192
-
193
-
194
-
195
-
196
-
197
-
198
-
199
-
200
-
201
-
202
-
203
-
204
-
205
-
206
-
207
-
208
-
209
-
210
-
211
-
212
-
213
-
214
-
215
-
216
-
217
-
218
-
219
-
220
-
221
-
222
-
223
-
224
-
225
-
226
-
227
-
228
-
229
-
230
-
231
-
232
-
233
-
234
-
235
-
236
-
237
-
238
-
239
-
240
-
241
-
242
-
243
-
244
-
245
-
246
-
247
-
248
-
249
-
250
-
251
-
252
 |
 |

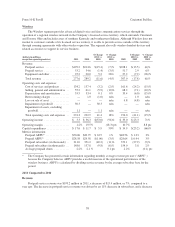
SG&A expenses were $37.4 million in 2011, a decrease of $0.3 million, or 1%, from the prior year. SG&A
was relatively flat despite higher revenues due to cost reduction initiatives.
The $1.1 million increase in depreciation and amortization expense for 2011 compared to 2010 was
primarily due to assets placed in service to support the expansion of managed services and professional services
projects.
Restructuring charges related to employee separation obligations of $1.9 million and $2.8 million were
recognized in 2011 and 2010, respectively. The consolidation of certain products and the continued integration of
certain functions into the Wireline segment led to these charges.
Capital Expenditures
Capital expenditures were $6.8 million in 2011 compared to $8.3 million in 2010. Capital expenditures were
higher in 2010 due to the start-up of a higher number of new managed service projects.
2010 Compared to 2009
Revenue
Revenue from telecom and IT equipment distribution was $174.9 million in 2010, an increase of $13.8
million, or 9%, compared to 2009. The increase in 2010 versus 2009 was primarily attributable to higher
hardware sales and increased capital spending by business customers from the prior year as a result of the
improving economy in 2010.
In 2010, managed services revenue was $55.1 million, an increase of $5.7 million, or 12%, compared to the
same period a year ago. The increase versus 2009 was primarily from a $5.2 million increase in services provided
to one of the Company’s largest customers.
Professional services revenue was $24.7 million for 2010, an increase of $3.9 million, or 19%, from a year
ago, as the Company continued to expand its portfolio of IT professionals to grow these outsourcing and
consulting engagements.
Costs and Expenses
Cost of services and products was $202.6 million in 2010, an increase of $20.5 million, or 11%, compared
to 2009. The increase was related to higher telecom and equipment distribution revenue and higher payroll
related costs to support the growth in managed services and professional services revenues.
SG&A expenses were $37.7 million in 2010, an increase of $5.4 million, or 17%, from the prior year. The
increase in 2010 was due to an increase of $6.1 million in payroll and employee related costs to support the
growing operations.
The increase in depreciation and amortization expense for 2010 compared to 2009 was primarily due to the
increased capital expenditures to support the expansion of managed services and professional services projects.
During 2010, the IT Services and Hardware segment incurred employee separation charges of $2.8 million
associated with the integration of certain functions with the Wireline segment.
Capital Expenditures
Capital expenditures were $8.3 million in 2010, up $4.5 million compared to 2009, due to higher spending
on new capital projects to begin new managed service projects.
Corporate
Corporate is comprised primarily of general and administrative costs that have not been allocated to the
business segments. Corporate costs totaled $28.5 million in 2011, $29.0 million in 2010, and $20.8 million in 2009.
44
Form 10-K Part II Cincinnati Bell Inc.