Cincinnati Bell 2011 Annual Report Download - page 212
Download and view the complete annual report
Please find page 212 of the 2011 Cincinnati Bell annual report below. You can navigate through the pages in the report by either clicking on the pages listed below, or by using the keyword search tool below to find specific information within the annual report.-
 1
1 -
2
-
3
-
4
-
5
-
6
-
7
-
8
-
9
-
10
-
11
-
12
-
13
-
14
-
15
-
16
-
17
-
18
-
19
-
20
-
21
-
22
-
23
-
24
-
25
-
26
-
27
-
28
-
29
-
30
-
31
-
32
-
33
-
34
-
35
-
36
-
37
-
38
-
39
-
40
-
41
-
42
-
43
-
44
-
45
-
46
-
47
-
48
-
49
-
50
-
51
-
52
-
53
-
54
-
55
-
56
-
57
-
58
-
59
-
60
-
61
-
62
-
63
-
64
-
65
-
66
-
67
-
68
-
69
-
70
-
71
-
72
-
73
-
74
-
75
-
76
-
77
-
78
-
79
-
80
-
81
-
82
-
83
-
84
-
85
-
86
-
87
-
88
-
89
-
90
-
91
-
92
-
93
-
94
-
95
-
96
-
97
-
98
-
99
-
100
-
101
-
102
-
103
-
104
-
105
-
106
-
107
-
108
-
109
-
110
-
111
-
112
-
113
-
114
-
115
-
116
-
117
-
118
-
119
-
120
-
121
-
122
-
123
-
124
-
125
-
126
-
127
-
128
-
129
-
130
-
131
-
132
-
133
-
134
-
135
-
136
-
137
-
138
-
139
-
140
-
141
-
142
-
143
-
144
-
145
-
146
-
147
-
148
-
149
-
150
-
151
-
152
-
153
-
154
-
155
-
156
-
157
-
158
-
159
-
160
-
161
-
162
-
163
-
164
-
165
-
166
-
167
-
168
-
169
-
170
-
171
-
172
-
173
-
174
-
175
-
176
-
177
-
178
-
179
-
180
-
181
-
182
-
183
-
184
-
185
-
186
-
187
-
188
-
189
-
190
-
191
-
192
-
193
-
194
-
195
-
196
-
197
-
198
-
199
-
200
-
201
-
 202
202 -
 203
203 -
 204
204 -
 205
205 -
 206
206 -
 207
207 -
 208
208 -
 209
209 -
 210
210 -
 211
211 -
 212
212 -
 213
213 -
 214
214 -
 215
215 -
 216
216 -
 217
217 -
 218
218 -
 219
219 -
 220
220 -
 221
221 -
 222
222 -
223
-
224
-
225
-
226
-
227
-
228
-
229
-
230
-
231
-
232
-
233
-
234
-
235
-
236
-
237
-
238
-
239
-
240
-
241
-
242
-
243
-
244
-
245
-
246
-
247
-
248
-
249
-
250
-
251
-
252
 |
 |

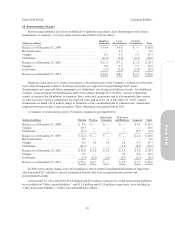
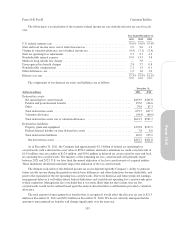
The carrying value and fair value of the Company’s financial instruments are as follows:
December 31, 2011 December 31, 2010
(dollars in millions) Carrying Value Fair Value Carrying Value Fair Value
Long-term debt, including current portion ............. $2,533.6 $2,460.5 $2,523.6 $2,416.9
Other financing arrangements ....................... 47.9 47.2 32.5 32.3
The fair value of debt instruments was based on closing or estimated market prices of the Company’s debt at
December 31, 2011 and 2010. The fair value of other financing arrangements was calculated using a discounted
cash flow model that incorporates current borrowing rates for obligations of similar duration.
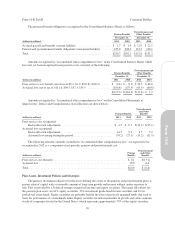
Non-Recurring Fair Value Measurements
Certain long-lived assets, intangibles, and goodwill are required to be measured at fair value on a
non-recurring basis subsequent to their initial measurement. These non-recurring fair value measurements
generally occur when evidence of impairment has occurred.
As of December 31, 2011, the following assets and liabilities were measured at fair value on a non-recurring
basis subsequent to their initial recognition:
Fair Value Measurements Using
(dollars in millions)
Year Ended
December 31,
2011
Quoted Prices
in Active
Markets for
Identical Assets
(Level 1)
Significant
Other
Observable
Inputs
(Level 2)
Significant
Unobservable
Inputs
(Level 3)
Total
Losses
Property ............................... $ — $ — $ — $ — $ (2.1)
Goodwill ............................... — — — — (50.3)
$(52.4)
In 2011, Wireless goodwill with a carrying value of $50.3 million was written down to its implied fair value
of zero. The implied fair value of the Wireless reporting unit was estimated using both income and market
methods, which were weighted 75% and 25%, respectively. The income approach utilized projected future cash
flows, discounted at the weighted average cost of capital for a comparable peer group of 11.5%. The market
approach utilized market multiples for selected guideline public companies. This fair value measurement is
considered a Level 3 measurement due to the significance of its unobservable inputs.
In 2011, certain property with a carrying amount of $2.1 million was written down to its estimated fair value
of zero. Fair value was determined to be zero due to the absence of a market to sell these assets. This fair value
measurement is considered a Level 3 measurement due to the significance of its unobservable inputs.
As of December 31, 2010, no assets or liabilities were measured at fair value on a non-recurring basis
subsequent to their initial recognition.
94
Form 10-K Part II Cincinnati Bell Inc.