Cincinnati Bell 2011 Annual Report Download - page 237
Download and view the complete annual report
Please find page 237 of the 2011 Cincinnati Bell annual report below. You can navigate through the pages in the report by either clicking on the pages listed below, or by using the keyword search tool below to find specific information within the annual report.-
 1
1 -
2
-
3
-
4
-
5
-
6
-
7
-
8
-
9
-
10
-
11
-
12
-
13
-
14
-
15
-
16
-
17
-
18
-
19
-
20
-
21
-
22
-
23
-
24
-
25
-
26
-
27
-
28
-
29
-
30
-
31
-
32
-
33
-
34
-
35
-
36
-
37
-
38
-
39
-
40
-
41
-
42
-
43
-
44
-
45
-
46
-
47
-
48
-
49
-
50
-
51
-
52
-
53
-
54
-
55
-
56
-
57
-
58
-
59
-
60
-
61
-
62
-
63
-
64
-
65
-
66
-
67
-
68
-
69
-
70
-
71
-
72
-
73
-
74
-
75
-
76
-
77
-
78
-
79
-
80
-
81
-
82
-
83
-
84
-
85
-
86
-
87
-
88
-
89
-
90
-
91
-
92
-
93
-
94
-
95
-
96
-
97
-
98
-
99
-
100
-
101
-
102
-
103
-
104
-
105
-
106
-
107
-
108
-
109
-
110
-
111
-
112
-
113
-
114
-
115
-
116
-
117
-
118
-
119
-
120
-
121
-
122
-
123
-
124
-
125
-
126
-
127
-
128
-
129
-
130
-
131
-
132
-
133
-
134
-
135
-
136
-
137
-
138
-
139
-
140
-
141
-
142
-
143
-
144
-
145
-
146
-
147
-
148
-
149
-
150
-
151
-
152
-
153
-
154
-
155
-
156
-
157
-
158
-
159
-
160
-
161
-
162
-
163
-
164
-
165
-
166
-
167
-
168
-
169
-
170
-
171
-
172
-
173
-
174
-
175
-
176
-
177
-
178
-
179
-
180
-
181
-
182
-
183
-
184
-
185
-
186
-
187
-
188
-
189
-
190
-
191
-
192
-
193
-
194
-
195
-
196
-
197
-
198
-
199
-
200
-
201
-
202
-
203
-
204
-
205
-
206
-
207
-
208
-
209
-
210
-
211
-
212
-
213
-
214
-
215
-
216
-
217
-
218
-
219
-
220
-
221
-
222
-
223
-
224
-
225
-
226
-
 227
227 -
 228
228 -
 229
229 -
 230
230 -
 231
231 -
 232
232 -
 233
233 -
 234
234 -
 235
235 -
 236
236 -
 237
237 -
 238
238 -
 239
239 -
 240
240 -
 241
241 -
 242
242 -
 243
243 -
 244
244 -
 245
245 -
 246
246 -
 247
247 -
248
-
249
-
250
-
251
-
252
 |
 |

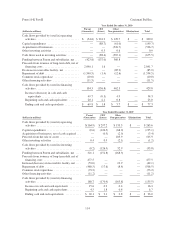
Form 10-K Part II Cincinnati Bell Inc.
Year Ended December 31, 2009
(dollars in millions)
Parent
(Issuer) Guarantors Non-guarantors Eliminations Total
Cash flows provided by (used in) operating
activities ................................ $(164.9) $ 184.4 $ 246.1 $ — $ 265.6
Capital expenditures ........................ (0.6) (68.0) (126.5) — (195.1)
Acquisitions of businesses ................... — (2.9) (0.5) — (3.4)
Proceeds from sale of assets .................. — 105.9 — — 105.9
Other investing activities ..................... 0.4 (2.1) 0.5 — (1.2)
Cash flows provided by (used in) investing
activities ................................ (0.2) 32.9 (126.5) — (93.8)
Funding between Parent and subsidiaries, net .... 321.1 (208.5) (112.6) — —
Proceeds from issuance of long-term debt, net of
financing costs ........................... 477.5 — — — 477.5
Increase/(decrease) in receivables facility, net .... (53.0) — 10.9 — (42.1)
Repayment of debt .......................... (480.5) (8.4) (17.6) — (506.5)
Common stock repurchase ................... (73.2) — — — (73.2)
Other financing activities .................... (11.2) — — — (11.2)
Cash flows provided by (used in) financing
activities ................................ 180.7 (216.9) (119.3) — (155.5)
Increase in cash and cash equivalents ......... 15.6 0.4 0.3 — 16.3
Beginning cash and cash equivalents ......... 4.5 0.4 1.8 — 6.7
Ending cash and cash equivalents ............ $ 20.1 $ 0.8 $ 2.1 $ — $ 23.0
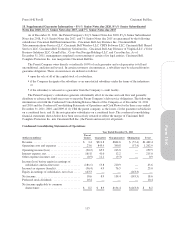
19. Quarterly Financial Information (Unaudited)
2011
(dollars in millions, except per common share amounts)
First
Quarter
Second
Quarter
Third
Quarter
Fourth
Quarter Total
Revenue ............................... $360.8 $367.5 $368.8 $365.3 $1,462.4
Operating income ........................ 86.4 77.6 86.3 9.2 259.5
Net income (loss) ........................ 17.9 13.5 17.6 (30.4) 18.6
Basic earnings (loss) per common share ...... $ 0.08 $ 0.06 $ 0.08 $ (0.17) $ 0.04
Diluted earnings (loss) per common share ..... $ 0.08 $ 0.05 $ 0.07 $ (0.17) $ 0.04
2010
(dollars in millions, except per common share amounts)
First
Quarter
Second
Quarter
Third
Quarter
Fourth
Quarter Total
Revenue ............................... $323.7 $338.6 $351.9 $362.8 $1,377.0
Operating income ........................ 82.4 69.8 82.6 64.5 299.3
Net income (loss) ........................ 22.8 9.6 14.5 (18.6) 28.3
Basic earnings (loss) per common share ...... $ 0.10 $ 0.03 $ 0.06 $ (0.11) $ 0.09
Diluted earnings (loss) per common share ..... $ 0.10 $ 0.03 $ 0.06 $ (0.11) $ 0.09
The effects of assumed common share conversions are determined independently for each respective quarter
and year and may not be dilutive during every period due to variations in operating results. Therefore, the sum of
quarterly per share results will not necessarily equal the per share results for the full year.
During the three months ended December 31, 2011, the Company recognized a goodwill impairment loss of
$50.3 million in the Wireless business segment. The impairment loss arose from declines in revenues and
wireless subscribers.
119
Form 10-K