Cincinnati Bell 2011 Annual Report Download - page 55
Download and view the complete annual report
Please find page 55 of the 2011 Cincinnati Bell annual report below. You can navigate through the pages in the report by either clicking on the pages listed below, or by using the keyword search tool below to find specific information within the annual report.-
 1
1 -
2
-
3
-
4
-
5
-
6
-
7
-
8
-
9
-
10
-
11
-
12
-
13
-
14
-
15
-
16
-
17
-
18
-
19
-
20
-
21
-
22
-
23
-
24
-
25
-
26
-
27
-
28
-
29
-
30
-
31
-
32
-
33
-
34
-
35
-
36
-
37
-
38
-
39
-
40
-
41
-
42
-
43
-
44
-
 45
45 -
 46
46 -
 47
47 -
 48
48 -
 49
49 -
 50
50 -
 51
51 -
 52
52 -
 53
53 -
 54
54 -
 55
55 -
 56
56 -
 57
57 -
 58
58 -
 59
59 -
 60
60 -
 61
61 -
 62
62 -
 63
63 -
 64
64 -
 65
65 -
66
-
67
-
68
-
69
-
70
-
71
-
72
-
73
-
74
-
75
-
76
-
77
-
78
-
79
-
80
-
81
-
82
-
83
-
84
-
85
-
86
-
87
-
88
-
89
-
90
-
91
-
92
-
93
-
94
-
95
-
96
-
97
-
98
-
99
-
100
-
101
-
102
-
103
-
104
-
105
-
106
-
107
-
108
-
109
-
110
-
111
-
112
-
113
-
114
-
115
-
116
-
117
-
118
-
119
-
120
-
121
-
122
-
123
-
124
-
125
-
126
-
127
-
128
-
129
-
130
-
131
-
132
-
133
-
134
-
135
-
136
-
137
-
138
-
139
-
140
-
141
-
142
-
143
-
144
-
145
-
146
-
147
-
148
-
149
-
150
-
151
-
152
-
153
-
154
-
155
-
156
-
157
-
158
-
159
-
160
-
161
-
162
-
163
-
164
-
165
-
166
-
167
-
168
-
169
-
170
-
171
-
172
-
173
-
174
-
175
-
176
-
177
-
178
-
179
-
180
-
181
-
182
-
183
-
184
-
185
-
186
-
187
-
188
-
189
-
190
-
191
-
192
-
193
-
194
-
195
-
196
-
197
-
198
-
199
-
200
-
201
-
202
-
203
-
204
-
205
-
206
-
207
-
208
-
209
-
210
-
211
-
212
-
213
-
214
-
215
-
216
-
217
-
218
-
219
-
220
-
221
-
222
-
223
-
224
-
225
-
226
-
227
-
228
-
229
-
230
-
231
-
232
-
233
-
234
-
235
-
236
-
237
-
238
-
239
-
240
-
241
-
242
-
243
-
244
-
245
-
246
-
247
-
248
-
249
-
250
-
251
-
252
 |
 |

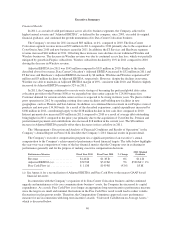
Although shareholders and proxy advisory companies tend to focus on “total shareholder return” (“TSR”) as
a major factor in judging a Company’s performance, we have historically adopted other measures of the
Company’s financial performance on the theory that using TSR as a financial metric might encourage a focus on
short-term results. For example, at a time when its core telecommunications business faced intense competitive
challenges, the Company has used its capital to seize the opportunity to become the premier data center
colocation provider to Fortune 1000 companies rather than pay dividends to its shareholders, which could be
detrimental to the Company’s long-term strategic opportunities. In addition, as a result of the scope of the
Company’s historical debt obligations and external economic factors (e.g., sovereign debt fears), the market price
of the Company’s common shares has been volatile and has not always fully reflected the Company’s operating
results and performance. Finally, the Committee questions the appropriateness of TSR as a financial metric given
its tendency to be influenced by external factors. As a result, the Company used the foregoing financial metrics to
measure its performance in 2011.
Actions Resulting from Negative Say-on-Pay Vote
After receiving a negative shareholder vote on the say-on-pay proposal at its May 2011 annual meeting, the
Company reached out to its major shareholders to discuss and understand the underlying reasons for their vote.
The Company had eight shareholders (equity, investment or mutual funds) that owned greater than 5% of the
outstanding common shares each, or 58.5% in the aggregate. The two major reasons heard by the Company for
the negative votes were: (i) the major shareholders did not have the resources or time to evaluate every company
in which they owned stock and, therefore, had adopted a policy of following ISS Corporate Services’ (“ISS”)
recommendation for the vote; and (ii) they did not understand the disclosures concerning, or did not support, the
2010 retention/discretionary bonus payments to the Company’s Chief Executive Officer (the “CEO” or “Chief
Executive Officer”) and the discretionary bonus payment made to Mr. Wojtaszek.
In addition, the Compensation Committee and its independent compensation consultant initiated a review of
certain aspects of the Company’s executive compensation program to determine whether there should be changes
to the process and substance of how compensation is determined.
•CEO Evaluation Process. The Compensation Committee considered whether the substantive evaluation
of the CEO’s performance should be made by the Governance and Nominating Committee and then
communicated to the Compensation Committee, which would consider and recommend the CEO’s
compensation levels. The decision reached was that it made the most sense to not bifurcate the process
and to leave the entire process with the Compensation Committee with the Committee’s recommendation
being presented to the Board for approval.
•Peer Group Modifications. The concerns were whether (i) the inclusion of large revenue
telecommunications companies in the peer groups caused the benchmark analysis to be higher than it
might otherwise be for an organization of the Company’s size and (ii) whether data center colocation
companies should be included in the peer groups. As indicated below, since executive compensation is
correlated with a company’s annual revenue, Towers Watson & Company, a global compensation and
benefits consulting firm (“Towers Watson”), and the Company use a statistical technique known as
“regression analysis” to adjust the compensation pay data of the peer groups’ companies to take into
account differences in revenue among the companies so that a company’s larger size does not skew the
peer groups’ data. In addition, with the shift of the Company’s strategy, they decided that data center
service providers should be added to the industry specific peer group.
•Annual Incentive Plan Data Center Performance Metrics. Historically, the Cincinnati Bell Inc. 2011
Short Term Incentive Plan performance metrics have been set on a company-wide basis without focusing
on a particular business segment. However, the Compensation Committee and its consultant determined,
in conjunction with the CEO’s recommendation, that 50% of the performance measures of
Mr. Wojtaszek’s 2012 annual incentives will be based on CyrusOne financial results (spread over two
metrics, Revenue and Adjusted EBITDA of CyrusOne).
•Long-Term Incentives. The Compensation Committee and its independent consultant examined various
aspects of the 2007 Long Term Incentive Plan, to determine whether the appropriate performance metrics
are being used. Consideration was given to determine if there is a proper correlation between risk and
41
Proxy Statement