Cincinnati Bell 2011 Annual Report Download - page 147
Download and view the complete annual report
Please find page 147 of the 2011 Cincinnati Bell annual report below. You can navigate through the pages in the report by either clicking on the pages listed below, or by using the keyword search tool below to find specific information within the annual report.-
 1
1 -
2
-
3
-
4
-
5
-
6
-
7
-
8
-
9
-
10
-
11
-
12
-
13
-
14
-
15
-
16
-
17
-
18
-
19
-
20
-
21
-
22
-
23
-
24
-
25
-
26
-
27
-
28
-
29
-
30
-
31
-
32
-
33
-
34
-
35
-
36
-
37
-
38
-
39
-
40
-
41
-
42
-
43
-
44
-
45
-
46
-
47
-
48
-
49
-
50
-
51
-
52
-
53
-
54
-
55
-
56
-
57
-
58
-
59
-
60
-
61
-
62
-
63
-
64
-
65
-
66
-
67
-
68
-
69
-
70
-
71
-
72
-
73
-
74
-
75
-
76
-
77
-
78
-
79
-
80
-
81
-
82
-
83
-
84
-
85
-
86
-
87
-
88
-
89
-
90
-
91
-
92
-
93
-
94
-
95
-
96
-
97
-
98
-
99
-
100
-
101
-
102
-
103
-
104
-
105
-
106
-
107
-
108
-
109
-
110
-
111
-
112
-
113
-
114
-
115
-
116
-
117
-
118
-
119
-
120
-
121
-
122
-
123
-
124
-
125
-
126
-
127
-
128
-
129
-
130
-
131
-
132
-
133
-
134
-
135
-
136
-
 137
137 -
 138
138 -
 139
139 -
 140
140 -
 141
141 -
 142
142 -
 143
143 -
 144
144 -
 145
145 -
 146
146 -
 147
147 -
 148
148 -
 149
149 -
 150
150 -
 151
151 -
 152
152 -
 153
153 -
 154
154 -
 155
155 -
 156
156 -
 157
157 -
158
-
159
-
160
-
161
-
162
-
163
-
164
-
165
-
166
-
167
-
168
-
169
-
170
-
171
-
172
-
173
-
174
-
175
-
176
-
177
-
178
-
179
-
180
-
181
-
182
-
183
-
184
-
185
-
186
-
187
-
188
-
189
-
190
-
191
-
192
-
193
-
194
-
195
-
196
-
197
-
198
-
199
-
200
-
201
-
202
-
203
-
204
-
205
-
206
-
207
-
208
-
209
-
210
-
211
-
212
-
213
-
214
-
215
-
216
-
217
-
218
-
219
-
220
-
221
-
222
-
223
-
224
-
225
-
226
-
227
-
228
-
229
-
230
-
231
-
232
-
233
-
234
-
235
-
236
-
237
-
238
-
239
-
240
-
241
-
242
-
243
-
244
-
245
-
246
-
247
-
248
-
249
-
250
-
251
-
252
 |
 |

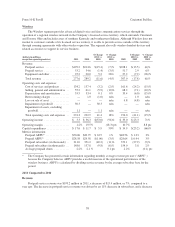
Form 10-K Part II Cincinnati Bell Inc.
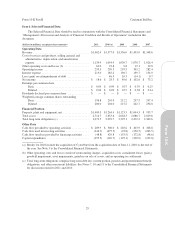
Item 6. Selected Financial Data
The Selected Financial Data should be read in conjunction with the Consolidated Financial Statements and
“Management’s Discussion and Analysis of Financial Condition and Results of Operations” included in this
document.
(dollars in millions, except per share amounts) 2011 2010 (a) 2009 2008 2007
Operating Data
Revenue ....................................... $1,462.4 $1,377.0 $1,336.0 $1,403.0 $1,348.6
Cost of services and products, selling, general and
administrative, depreciation, and amortization
expense ..................................... 1,139.9 1,054.9 1,030.7 1,078.7 1,026.4
Other operating costs and losses (b) ................. 63.0 22.8 9.8 19.1 39.8
Operating income ............................... 259.5 299.3 295.5 305.2 282.4
Interest expense ................................. 215.0 185.2 130.7 139.7 154.9
Loss (gain) on extinguishment of debt ............... — 46.5 10.3 (14.1) 0.7
Net income .................................... $ 18.6 $ 28.3 $ 89.6 $ 102.6 $ 73.2
Earnings per common share
Basic ..................................... $ 0.04 $ 0.09 $ 0.37 $ 0.39 $ 0.25
Diluted .................................... $ 0.04 $ 0.09 $ 0.37 $ 0.38 $ 0.24
Dividends declared per common share ............... $ — $ — $ — $ — $ —
Weighted-average common shares outstanding
Basic ..................................... 196.8 201.0 212.2 237.5 247.4
Diluted .................................... 200.0 204.0 215.2 242.7 256.8
Financial Position
Property, plant and equipment, net .................. $1,400.5 $1,264.4 $1,123.3 $1,044.3 $ 933.7
Total assets .................................... 2,714.7 2,653.6 2,064.3 2,086.7 2,019.6
Total long-term obligations (c) ..................... 3,073.5 2,992.7 2,395.1 2,472.2 2,369.6
Other Data
Cash flow provided by operating activities ............ $ 289.9 $ 300.0 $ 265.6 $ 403.9 $ 308.8
Cash flow used in investing activities ................ (244.7) (675.5) (93.8) (250.5) (263.5)
Cash flow (used in) provided by financing activities .... (48.8) 429.8 (155.5) (172.8) (98.6)
Capital expenditures ............................. (255.5) (149.7) (195.1) (230.9) (233.8)
(a) Results for 2010 include the acquisition of CyrusOne from the acquisition date of June 11, 2010 to the end of
the year. See Note 3 to the Consolidated Financial Statements.
(b) Other operating costs and losses consist of restructuring charges, acquisition costs, curtailment losses (gains),
goodwill impairment, asset impairments, gain/loss on sale of assets, and an operating tax settlement.
(c) Total long-term obligations comprise long-term debt less current portion, pension and postretirement benefit
obligations, and other noncurrent liabilities. See Notes 7, 10 and 11 to the Consolidated Financial Statements
for discussion related to 2011 and 2010.
29
Form 10-K