Cincinnati Bell 2011 Annual Report Download - page 224
Download and view the complete annual report
Please find page 224 of the 2011 Cincinnati Bell annual report below. You can navigate through the pages in the report by either clicking on the pages listed below, or by using the keyword search tool below to find specific information within the annual report.-
 1
1 -
2
-
3
-
4
-
5
-
6
-
7
-
8
-
9
-
10
-
11
-
12
-
13
-
14
-
15
-
16
-
17
-
18
-
19
-
20
-
21
-
22
-
23
-
24
-
25
-
26
-
27
-
28
-
29
-
30
-
31
-
32
-
33
-
34
-
35
-
36
-
37
-
38
-
39
-
40
-
41
-
42
-
43
-
44
-
45
-
46
-
47
-
48
-
49
-
50
-
51
-
52
-
53
-
54
-
55
-
56
-
57
-
58
-
59
-
60
-
61
-
62
-
63
-
64
-
65
-
66
-
67
-
68
-
69
-
70
-
71
-
72
-
73
-
74
-
75
-
76
-
77
-
78
-
79
-
80
-
81
-
82
-
83
-
84
-
85
-
86
-
87
-
88
-
89
-
90
-
91
-
92
-
93
-
94
-
95
-
96
-
97
-
98
-
99
-
100
-
101
-
102
-
103
-
104
-
105
-
106
-
107
-
108
-
109
-
110
-
111
-
112
-
113
-
114
-
115
-
116
-
117
-
118
-
119
-
120
-
121
-
122
-
123
-
124
-
125
-
126
-
127
-
128
-
129
-
130
-
131
-
132
-
133
-
134
-
135
-
136
-
137
-
138
-
139
-
140
-
141
-
142
-
143
-
144
-
145
-
146
-
147
-
148
-
149
-
150
-
151
-
152
-
153
-
154
-
155
-
156
-
157
-
158
-
159
-
160
-
161
-
162
-
163
-
164
-
165
-
166
-
167
-
168
-
169
-
170
-
171
-
172
-
173
-
174
-
175
-
176
-
177
-
178
-
179
-
180
-
181
-
182
-
183
-
184
-
185
-
186
-
187
-
188
-
189
-
190
-
191
-
192
-
193
-
194
-
195
-
196
-
197
-
198
-
199
-
200
-
201
-
202
-
203
-
204
-
205
-
206
-
207
-
208
-
209
-
210
-
211
-
212
-
213
-
 214
214 -
 215
215 -
 216
216 -
 217
217 -
 218
218 -
 219
219 -
 220
220 -
 221
221 -
 222
222 -
 223
223 -
 224
224 -
 225
225 -
 226
226 -
 227
227 -
 228
228 -
 229
229 -
 230
230 -
 231
231 -
 232
232 -
 233
233 -
 234
234 -
235
-
236
-
237
-
238
-
239
-
240
-
241
-
242
-
243
-
244
-
245
-
246
-
247
-
248
-
249
-
250
-
251
-
252
 |
 |

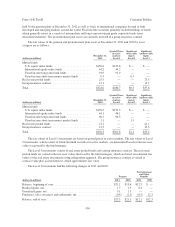
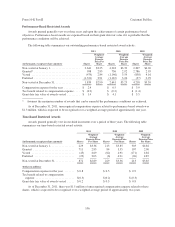
Performance-Based Restricted Awards
Awards granted generally vest over three years and upon the achievement of certain performance-based
objectives. Performance-based awards are expensed based on their grant date fair value if it is probable that the
performance conditions will be achieved.
The following table summarizes our outstanding performance-based restricted award activity:
2011 2010 2009
(in thousands, except per share amounts) Shares
Weighted-
Average
Exercise
Price Per
Share Shares
Weighted-
Average
Exercise
Price Per
Share Shares
Weighted-
Average
Exercise
Price Per
Share
Non-vested at January 1, .................... 2,641 $3.25 4,218 $3.39 2,307 $4.20
Granted* ................................ 998 2.85 736 2.92 2,786 2.95
Vested .................................. (479) 2.84 (1,146) 3.59 (838) 4.16
Forfeited ................................ (1,321) 3.91 (1,167) 3.20 (37) 2.99
Non-vested at December 31, ................. 1,839 $2.90 2,641 $3.25 4,218 $3.39
Compensation expense for the year ........... $ 2.4 $ 0.5 $ 3.9
Tax benefit related to compensation expense . . . . $ (0.9) $ (0.2) $ (1.4)
Grant date fair value of awards vested ......... $ 1.4 $ 4.1 $ 3.5
* Assumes the maximum number of awards that can be earned if the performance conditions are achieved.
As of December 31, 2011, unrecognized compensation expense related to performance-based awards was
$1.3 million, which is expected to be recognized over a weighted-average period of approximately one year.
Time-Based Restricted Awards
Awards granted generally vest in one-third increments over a period of three years. The following table
summarizes our time-based restricted award activity:
2011 2010 2009
(in thousands, except per share amounts) Shares
Weighted-
Average
Exercise Price
Per Share Shares
Weighted-
Average
Exercise Price
Per Share Shares
Weighted-
Average
Exercise Price
Per Share
Non-vested at January 1, ................ 229 $3.36 213 $3.85 303 $4.82
Granted ............................. 711 2.85 84 3.35 107 2.90
Vested .............................. (45) 4.69 (62) 4.91 (171) 4.82
Forfeited ............................ (23) 3.03 (6) 4.91 (26) 4.87
Non-vested at December 31, ............. 872 $2.89 229 $3.36 213 $3.85
(dollars in millions)
Compensation expense for the year ....... $0.8 $0.5 $ 0.9
Tax benefit related to compensation
expense ........................... $(0.3) $(0.2) $ (0.3)
Grant date fair value of awards vested ..... $0.2 $0.3 $ 0.8
As of December 31, 2011, there was $1.5 million of unrecognized compensation expense related to these
shares, which is expected to be recognized over a weighted-average period of approximately two years.
106
Form 10-K Part II Cincinnati Bell Inc.