Cincinnati Bell 2011 Annual Report Download - page 155
Download and view the complete annual report
Please find page 155 of the 2011 Cincinnati Bell annual report below. You can navigate through the pages in the report by either clicking on the pages listed below, or by using the keyword search tool below to find specific information within the annual report.-
 1
1 -
2
-
3
-
4
-
5
-
6
-
7
-
8
-
9
-
10
-
11
-
12
-
13
-
14
-
15
-
16
-
17
-
18
-
19
-
20
-
21
-
22
-
23
-
24
-
25
-
26
-
27
-
28
-
29
-
30
-
31
-
32
-
33
-
34
-
35
-
36
-
37
-
38
-
39
-
40
-
41
-
42
-
43
-
44
-
45
-
46
-
47
-
48
-
49
-
50
-
51
-
52
-
53
-
54
-
55
-
56
-
57
-
58
-
59
-
60
-
61
-
62
-
63
-
64
-
65
-
66
-
67
-
68
-
69
-
70
-
71
-
72
-
73
-
74
-
75
-
76
-
77
-
78
-
79
-
80
-
81
-
82
-
83
-
84
-
85
-
86
-
87
-
88
-
89
-
90
-
91
-
92
-
93
-
94
-
95
-
96
-
97
-
98
-
99
-
100
-
101
-
102
-
103
-
104
-
105
-
106
-
107
-
108
-
109
-
110
-
111
-
112
-
113
-
114
-
115
-
116
-
117
-
118
-
119
-
120
-
121
-
122
-
123
-
124
-
125
-
126
-
127
-
128
-
129
-
130
-
131
-
132
-
133
-
134
-
135
-
136
-
137
-
138
-
139
-
140
-
141
-
142
-
143
-
144
-
 145
145 -
 146
146 -
 147
147 -
 148
148 -
 149
149 -
 150
150 -
 151
151 -
 152
152 -
 153
153 -
 154
154 -
 155
155 -
 156
156 -
 157
157 -
 158
158 -
 159
159 -
 160
160 -
 161
161 -
 162
162 -
 163
163 -
 164
164 -
 165
165 -
166
-
167
-
168
-
169
-
170
-
171
-
172
-
173
-
174
-
175
-
176
-
177
-
178
-
179
-
180
-
181
-
182
-
183
-
184
-
185
-
186
-
187
-
188
-
189
-
190
-
191
-
192
-
193
-
194
-
195
-
196
-
197
-
198
-
199
-
200
-
201
-
202
-
203
-
204
-
205
-
206
-
207
-
208
-
209
-
210
-
211
-
212
-
213
-
214
-
215
-
216
-
217
-
218
-
219
-
220
-
221
-
222
-
223
-
224
-
225
-
226
-
227
-
228
-
229
-
230
-
231
-
232
-
233
-
234
-
235
-
236
-
237
-
238
-
239
-
240
-
241
-
242
-
243
-
244
-
245
-
246
-
247
-
248
-
249
-
250
-
251
-
252
 |
 |

Form 10-K Part II Cincinnati Bell Inc.
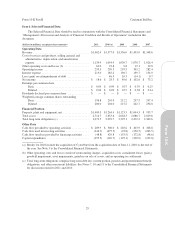
2010 Compared to 2009
Revenues
Voice local service revenue was $311.9 million in 2010, a decrease of 10% compared to the prior period.
The decrease in revenue was driven by a decrease in the use of local access lines from the prior year. Access
lines decreased by 49,400, or 7%.
Data revenue was $283.3 million in 2010, which was essentially flat compared to the same period in 2009.
As of December 31, 2010, the Company had 27,200 high-speed internet Fioptics subscribers, which is a 13,400
subscriber, or 97%, increase, from the December 31, 2009 total of 13,800 subscribers. These increases were
primarily offset by lower DSL revenue resulting from a decline in subscribers and average revenue per
subscriber.
Long distance and VoIP revenue was $104.4 million in 2010, an increase of $7.3 million, or 8%, compared
to 2009. The increase was primarily attributable to an increase in VoIP and audio conferencing services provided
to additional subscribers. This increase was partially offset by a 5% decrease in long distance subscriber lines,
which is consistent with the local voice access line loss.
Entertainment revenue was $16.7 million in 2010, up $9.0 million, or 117%, compared to 2009. Fioptics
entertainment revenue grew by $7.5 million compared to the same period in 2009. Fioptics entertainment
subscribers totaled 28,100 at December 31, 2010, an increase of 85% compared to December 31, 2009. The
increase in entertainment subscribers is related to expansions of the Fioptics network and high customer demand.
Other revenue was $26.2 million for 2010, substantially the same as 2009.
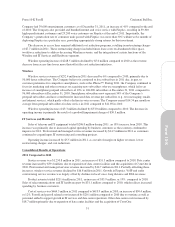
Costs and Expenses
Cost of services and products was $256.8 million, an increase of $5.2 million, or 2%, versus 2009. The
increase was primarily driven by higher network costs to support growth in VoIP and Fioptics revenues, higher
operating taxes and higher costs associated with employee healthcare benefits. These expenses were offset by a
decrease in costs from lower wages and less pension and postretirement costs.
SG&A expenses were $140.1 million, a decrease of $6.9 million, or 5%, versus a year ago. The decrease
was primarily due to a $4.1 million decrease in bad debt expense, decreases in costs from third-party service
providers and lower advertising expenses.
Depreciation and amortization was $103.9 million in 2010, flat as compared to a year ago.
Restructuring charges in 2010 were $8.2 million, a decrease of $4.4 million compared to the prior year.
Restructuring charges in 2010 were from employee separation obligations of $4.9 million and future lease costs
on abandoned office space of $3.3 million. Restructuring expenses for 2009 resulted from employee separation
obligations and amortization of pension and postretirement special termination benefits related to early
retirement offers. A curtailment gain of $7.6 million was also recognized in 2009. See Notes 10 and 11 to the
Consolidated Financial Statements for further information.
Capital Expenditures
Capital expenditures were $98.6 million in 2010, a decrease of $34.4 million, or 26%, compared to 2009.
The decrease is primarily related to lower capital spending on the fiber network in 2010.
37
Form 10-K